How to Read My NASA GLOBE Clouds Satellite Comparison Table - Clouds Protocol


How to Read My NASA GLOBE Clouds Satellite Comparison Table
The satellite comparison table summarizes your ground observations of clouds and sky conditions with data from satellites collected at about the same time over or nearby your location.
Understanding the Three Parts of Your Satellite Match Table: Top, Middle, and Bottom
PLEASE NOTE, cloud properties obtained from satellites should not be considered absolute truth, but rather the best estimate of cloud properties that can be provided by satellite observations. Your point of view of the sky (from the ground looking up) is different from the instruments on the satellites (from space looking down). For each section, look at the overall comparisons between your report, and the resulting satellite data. Let's go over what to focus on in each section.
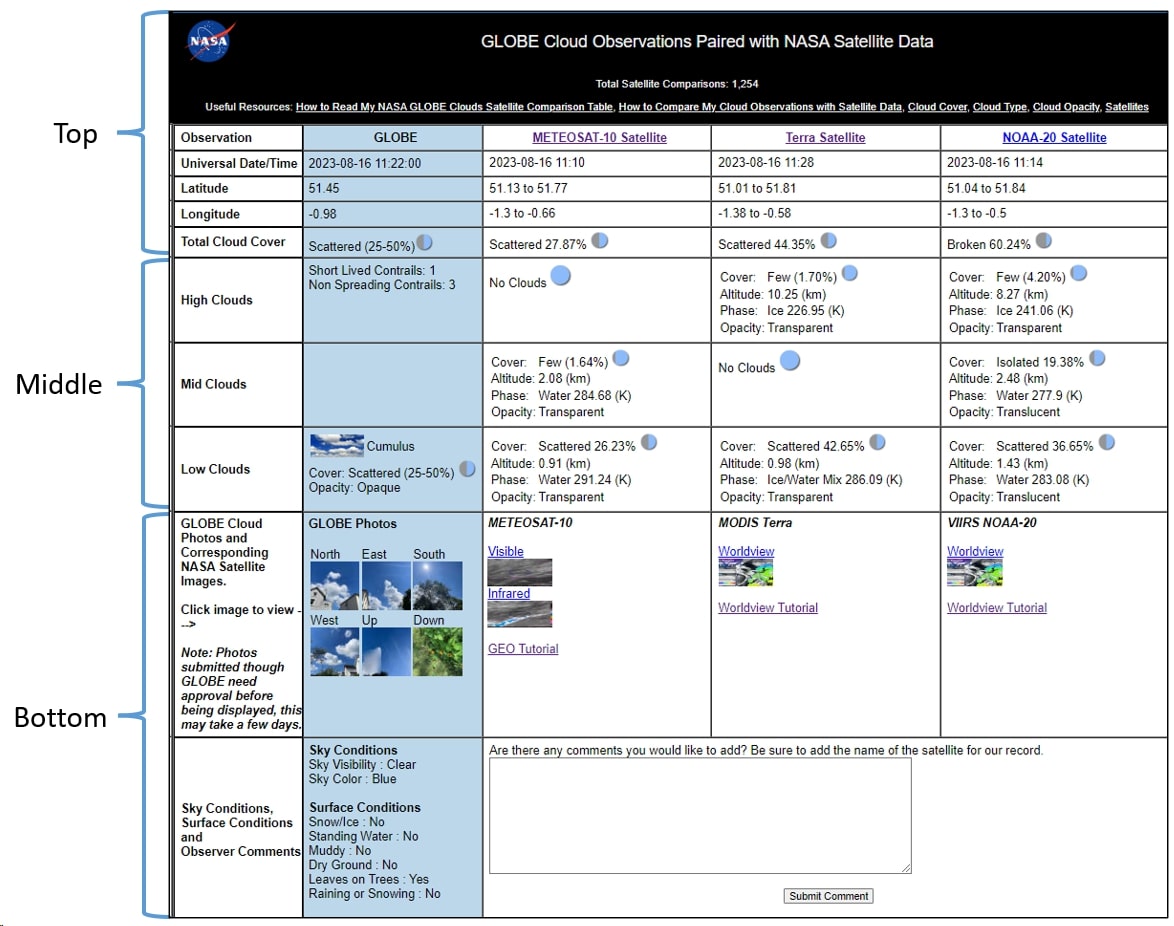
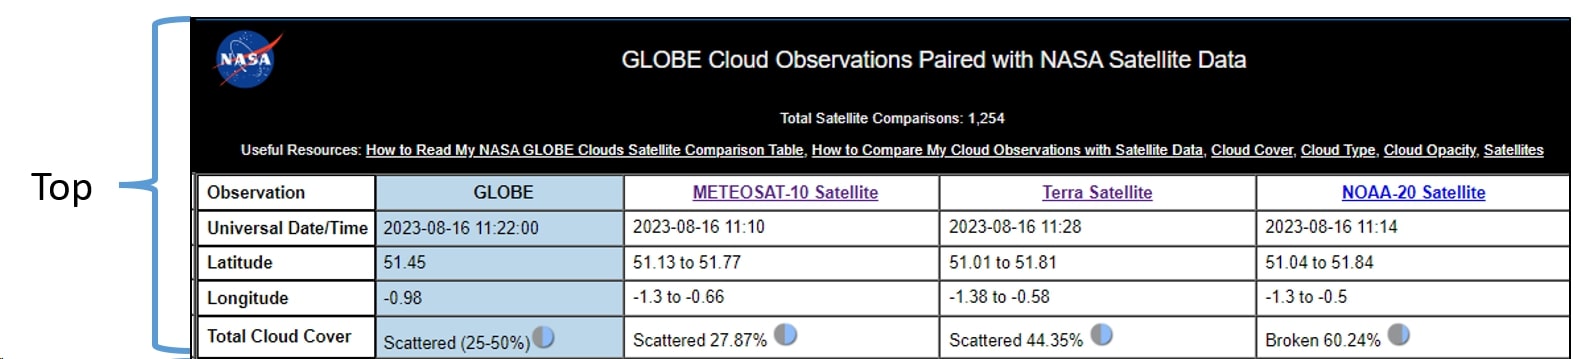
1. The Top Section
Caption: Tip 1: Focus on how the results compare to each other instead of which ones are correct.
The top section of the table contains the title, the number of your observations that have been paired with satellite data so far, and links to useful resources to help you understand your satellite comparison. The white column on the left lists all the data variables reported. This information includes latitude & longitude, date & time, total cloud cover, clouds by altitude (low, mid, high), your photos and satellite images, sky conditions, and surface conditions. The second column colored in blue displays your observations submitted to GLOBE. The satellite data is found in the following columns next to your observations with the names of each satellite on the second row. Reports may include data from geostationary satellites like GOES, METEOSAT, and HIMAWARI. It may also include data from polar-orbiting satellites such as Terra and NOAA-20. Satellites report cloud cover, cloud altitude, cloud phase (liquid, ice, or mix), and cloud opacity (transparent, translucent, or opaque). “Total Cloud Cover” reports from the satellites are a percentage cover number, while your observations are reported in an approximated range. The circle symbols represent a range of observation options to select from (see image below).
Caption: Use the symbols to see if the satellite reports fall into the same category as your report.

2. The Middle Section

Caption: Look at the level (low, mid, or high) with the highest amount of clouds reported. Good agreement between your observations and all the different satellites is when the highest amount of clouds were reported at the same altitude. Any differences would be interesting to investigate by looking at the photographs you submitted with your cloud report and the satellite images.
The middle section provides information about the amount and characteristics of observed clouds. This data is divided by the altitude level at the base of the clouds. Clouds with bases lower than 2,000 meters are considered low-level clouds, clouds with a base between 2,000-6,000 meters are mid-level clouds, while high clouds are those with a base higher than 6,000 meters. Satellites do not report the type of cloud, but provide information on the characteristics of the clouds detected, such as percentage cover, altitude, phase, and opacity. Cloud altitude is measured in kilometers (km), so 2,000 meters would be 2km. Cloud phase (liquid, ice, or mix) is measured in degrees Kelvin (K). Opacity is reported as transparent, translucent, or opaque. You can compare your observations to the satellite data and see if they agree in the opacity and cloud cover for that level.
3. The Bottom Section
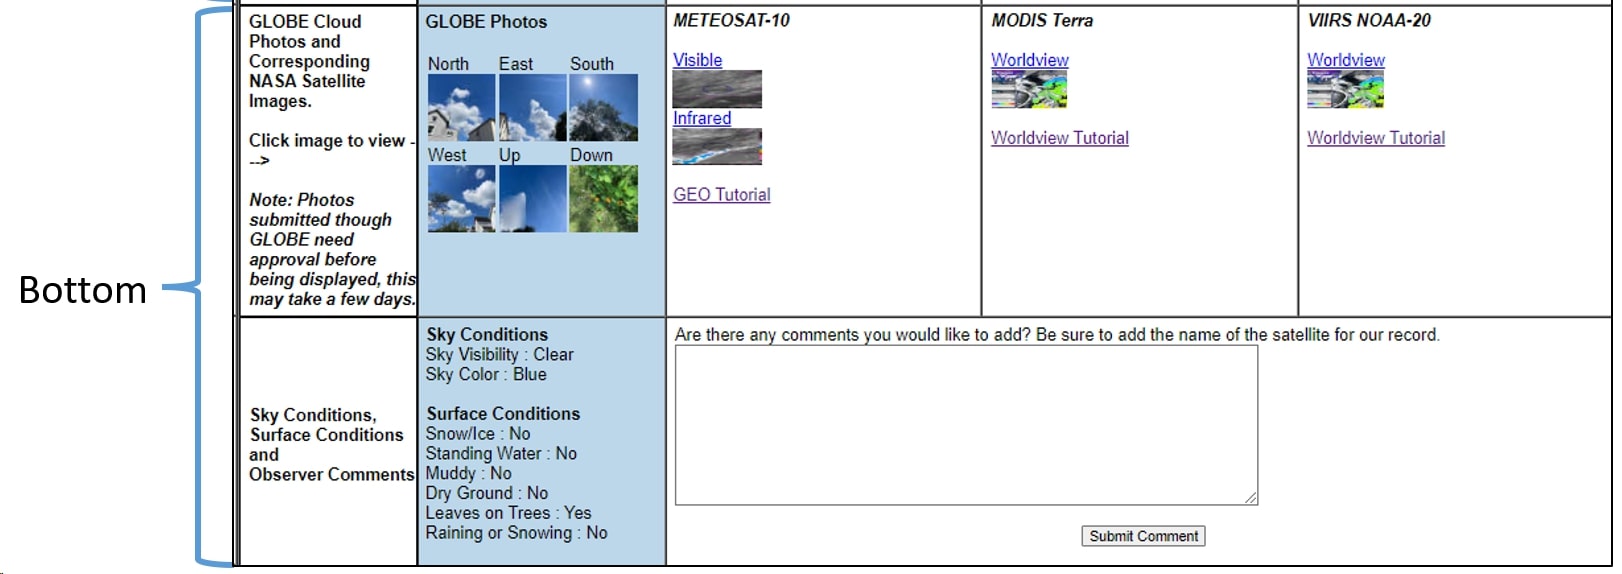
The bottom section includes your photographs, images taken by the NASA satellites, the sky and surface conditions, as well as a place to add comments. Your photos will not show up until approved, this may take a few days. Your photographs are incredibly valuable to researchers, who get an on-ground view to better understand observation reports. Your observation also includes the information about surface conditions reported. You can click on the small pictures under each satellite column to open the satellite image. The satellite images provided are centered over your location! For geostationary satellites, your location is represented by a dot. These images will also have a red circle marking a 40 kilometer diameter area around your location. For Terra and NOAA-20 satellites, a link to NASA’s visualization program (Worldview) will be included in the email. Based on your data, the Worldview link will be centered around your location, allowing you to zoom in and out, as well as add other data fields. You can use the satellite interpretation guides for geostationary, or the MODIS instrument on the Terra and NOAA-20 satellites as appropriate. In the “submit comment” section, you can send in any questions or comments related to your observation.
Helpful Hint: Look through the satellite images for cloud puffs or thin layers. Just like cumulus clouds are described as puffy, they will also look puffy in satellite images. Thin wispy cirrus clouds look thin in satellite imagery as well.
What if the satellite data is not the same as my observation?
Cloud cover differences can be because of many variables. Maybe the satellite saw clouds at layers you were not able to detect with your eyes. Perhaps it was hard for you to choose the range of cloud cover. You can try the cloud cover estimation activity, and test your skills with cloud covers created by others!
Focus on the big picture. Ask yourself which layer had the most clouds reported by all views, or whether the opacity is in agreement through each report. Noticing where the observations agree will give you a better idea as to why there are differences, big or small, and especially when you look at the images in the last section of the report.
Clouds are a key factor influencing local weather as well as the Earth’s climate system. Satellites can only capture a top-down view of our planet. Your ground observations complement what the satellites cannot see. When you make a GLOBE cloud observation timed to a satellite overpass (within 15 minutes of a satellite observation), then both points of view are matched. Your cloud observations, timed to satellite overpass times, are an important part of the Earth system puzzle NASA is actively building.