RE: A GLOBEal Window of Opportunity - Grade 6 - 2020 SRS - 2020 SRS
GLOBE Breadcrumb
- Home >
- 2020 SRS
Open social media sharing options menu
 Share
Share


GLOBE Side Navigation
Site Name
2020 Student Research Symposium (SRS)
Message Boards


0
Project Title: A GLOBEal Window of Opportunity - Grade 6
School Name: Alpena Elementary/Middle School
Teacher Name: Roger Rose
Student Name: Bayleigh Jetton & Elizabeth Hernandez
Grade Level: 6
Project Description: A study conducted using GLOBE protocols to analyze how the weather changes during the two-hour solar noon window for data collection.
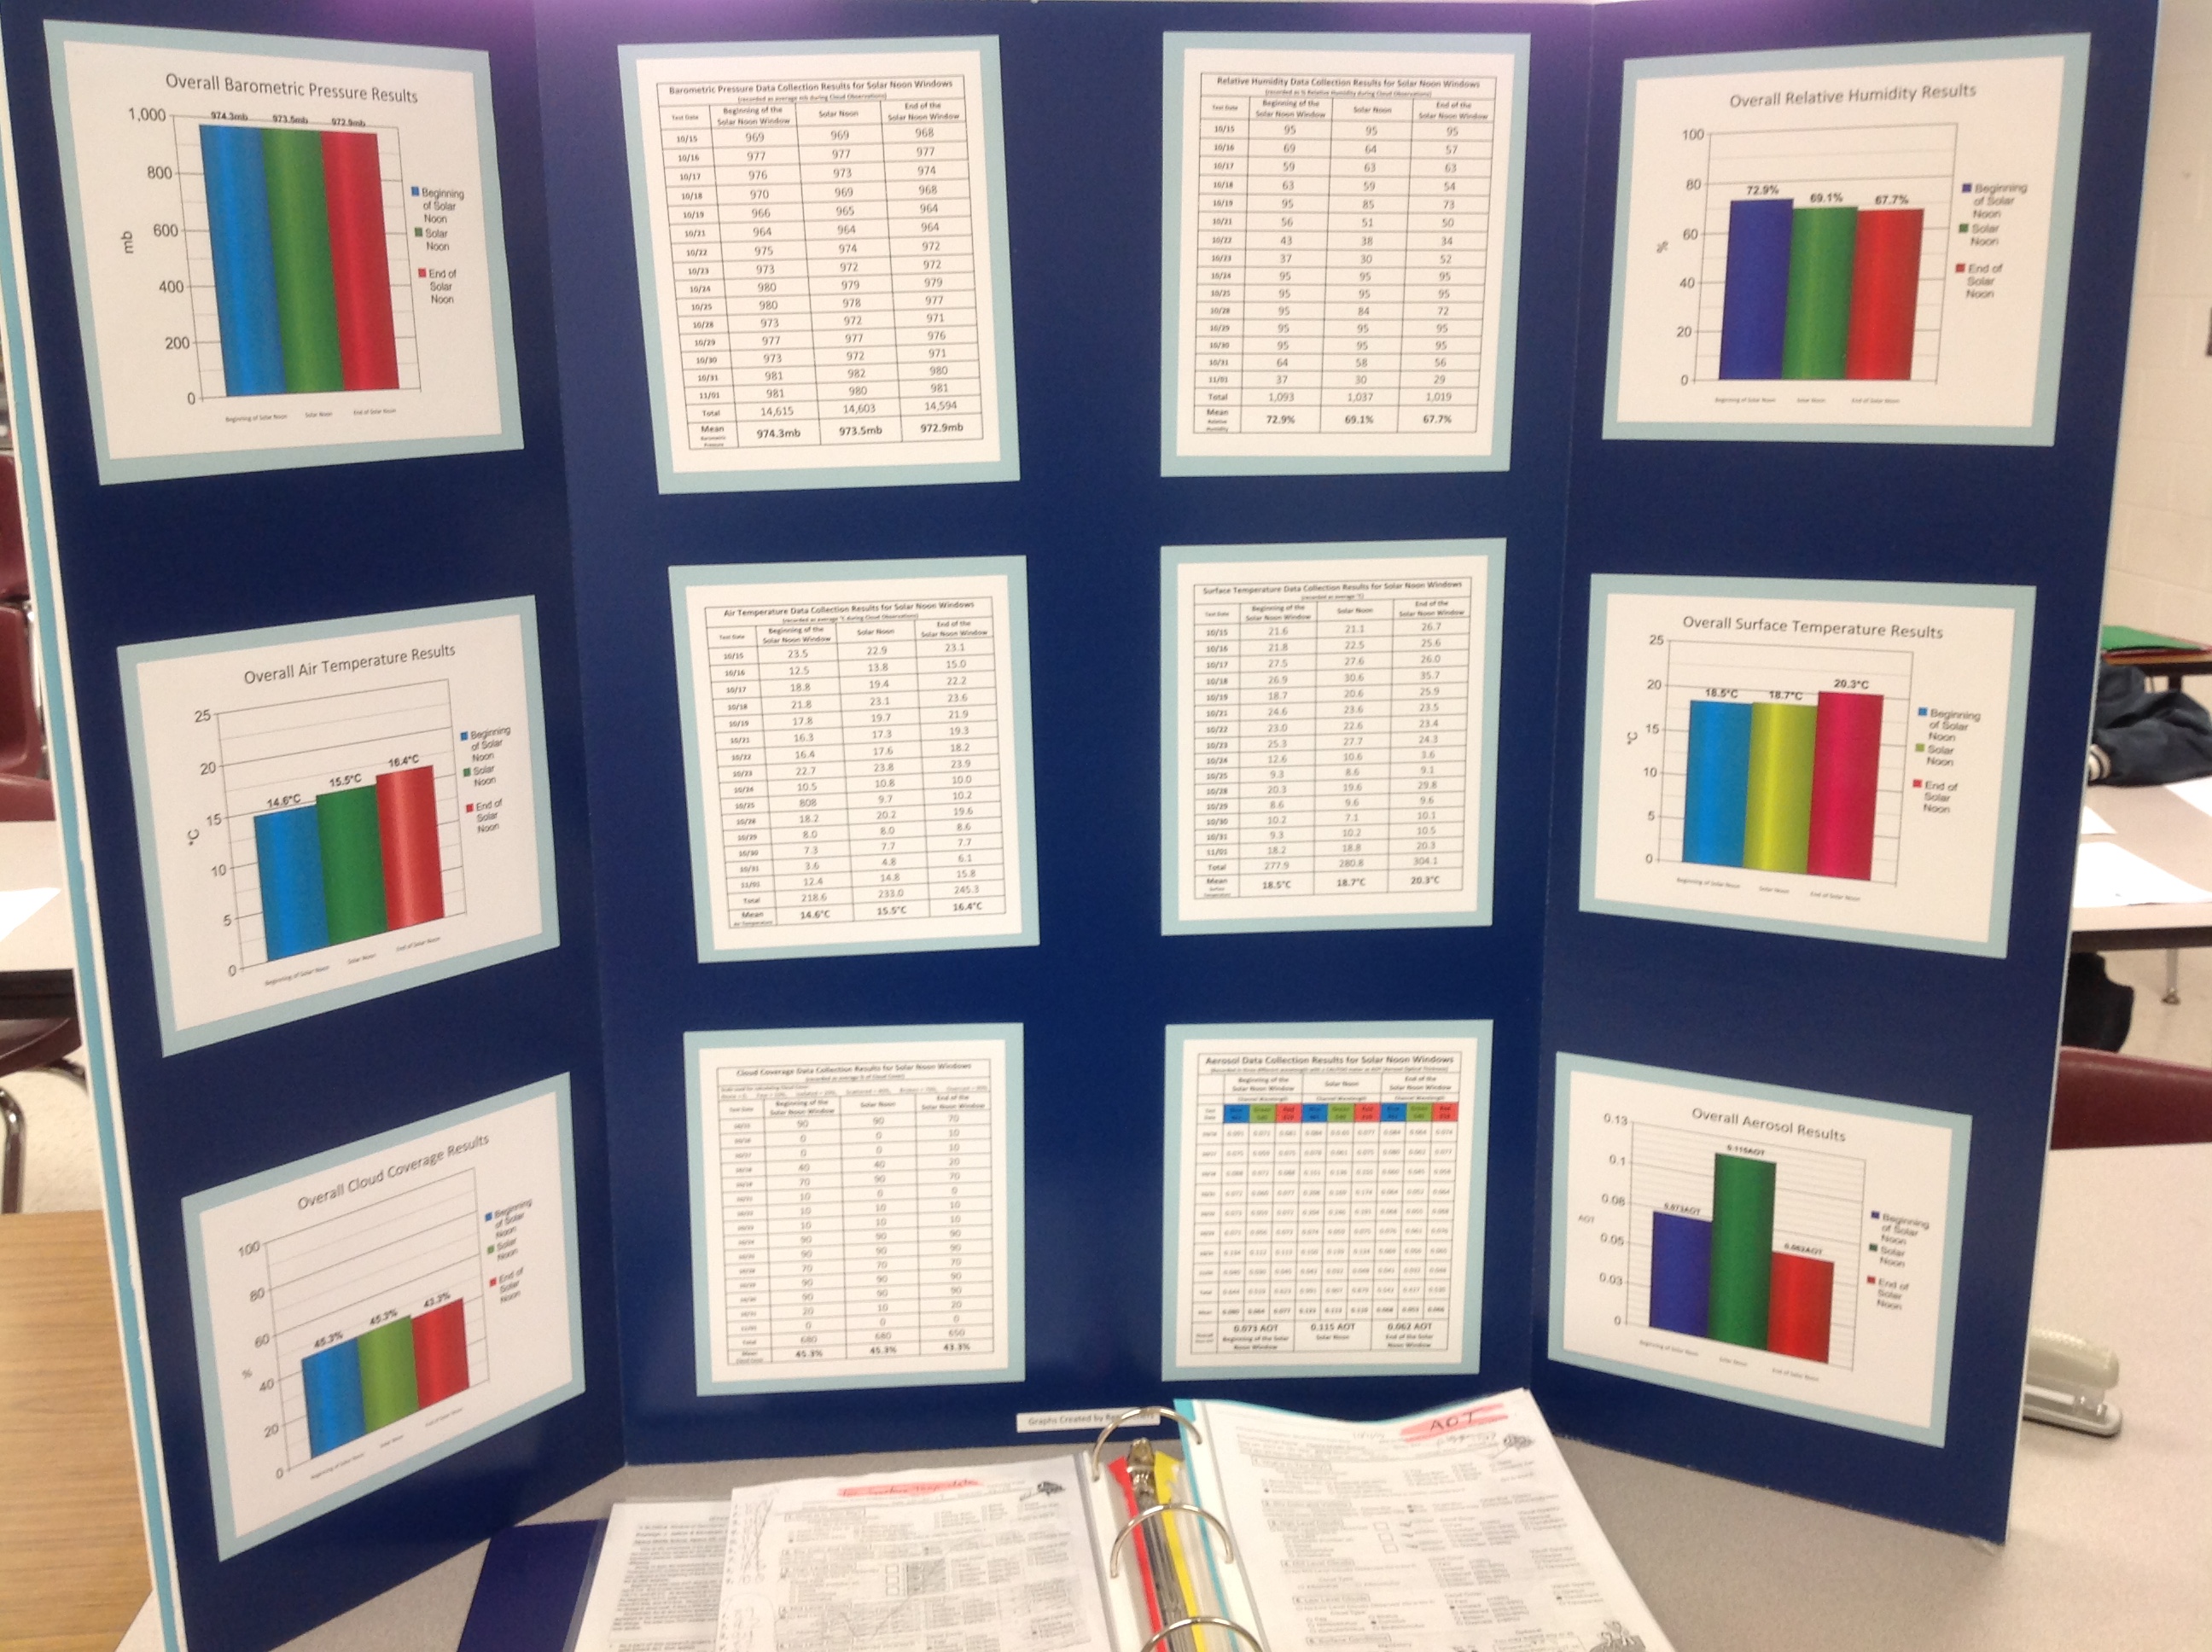
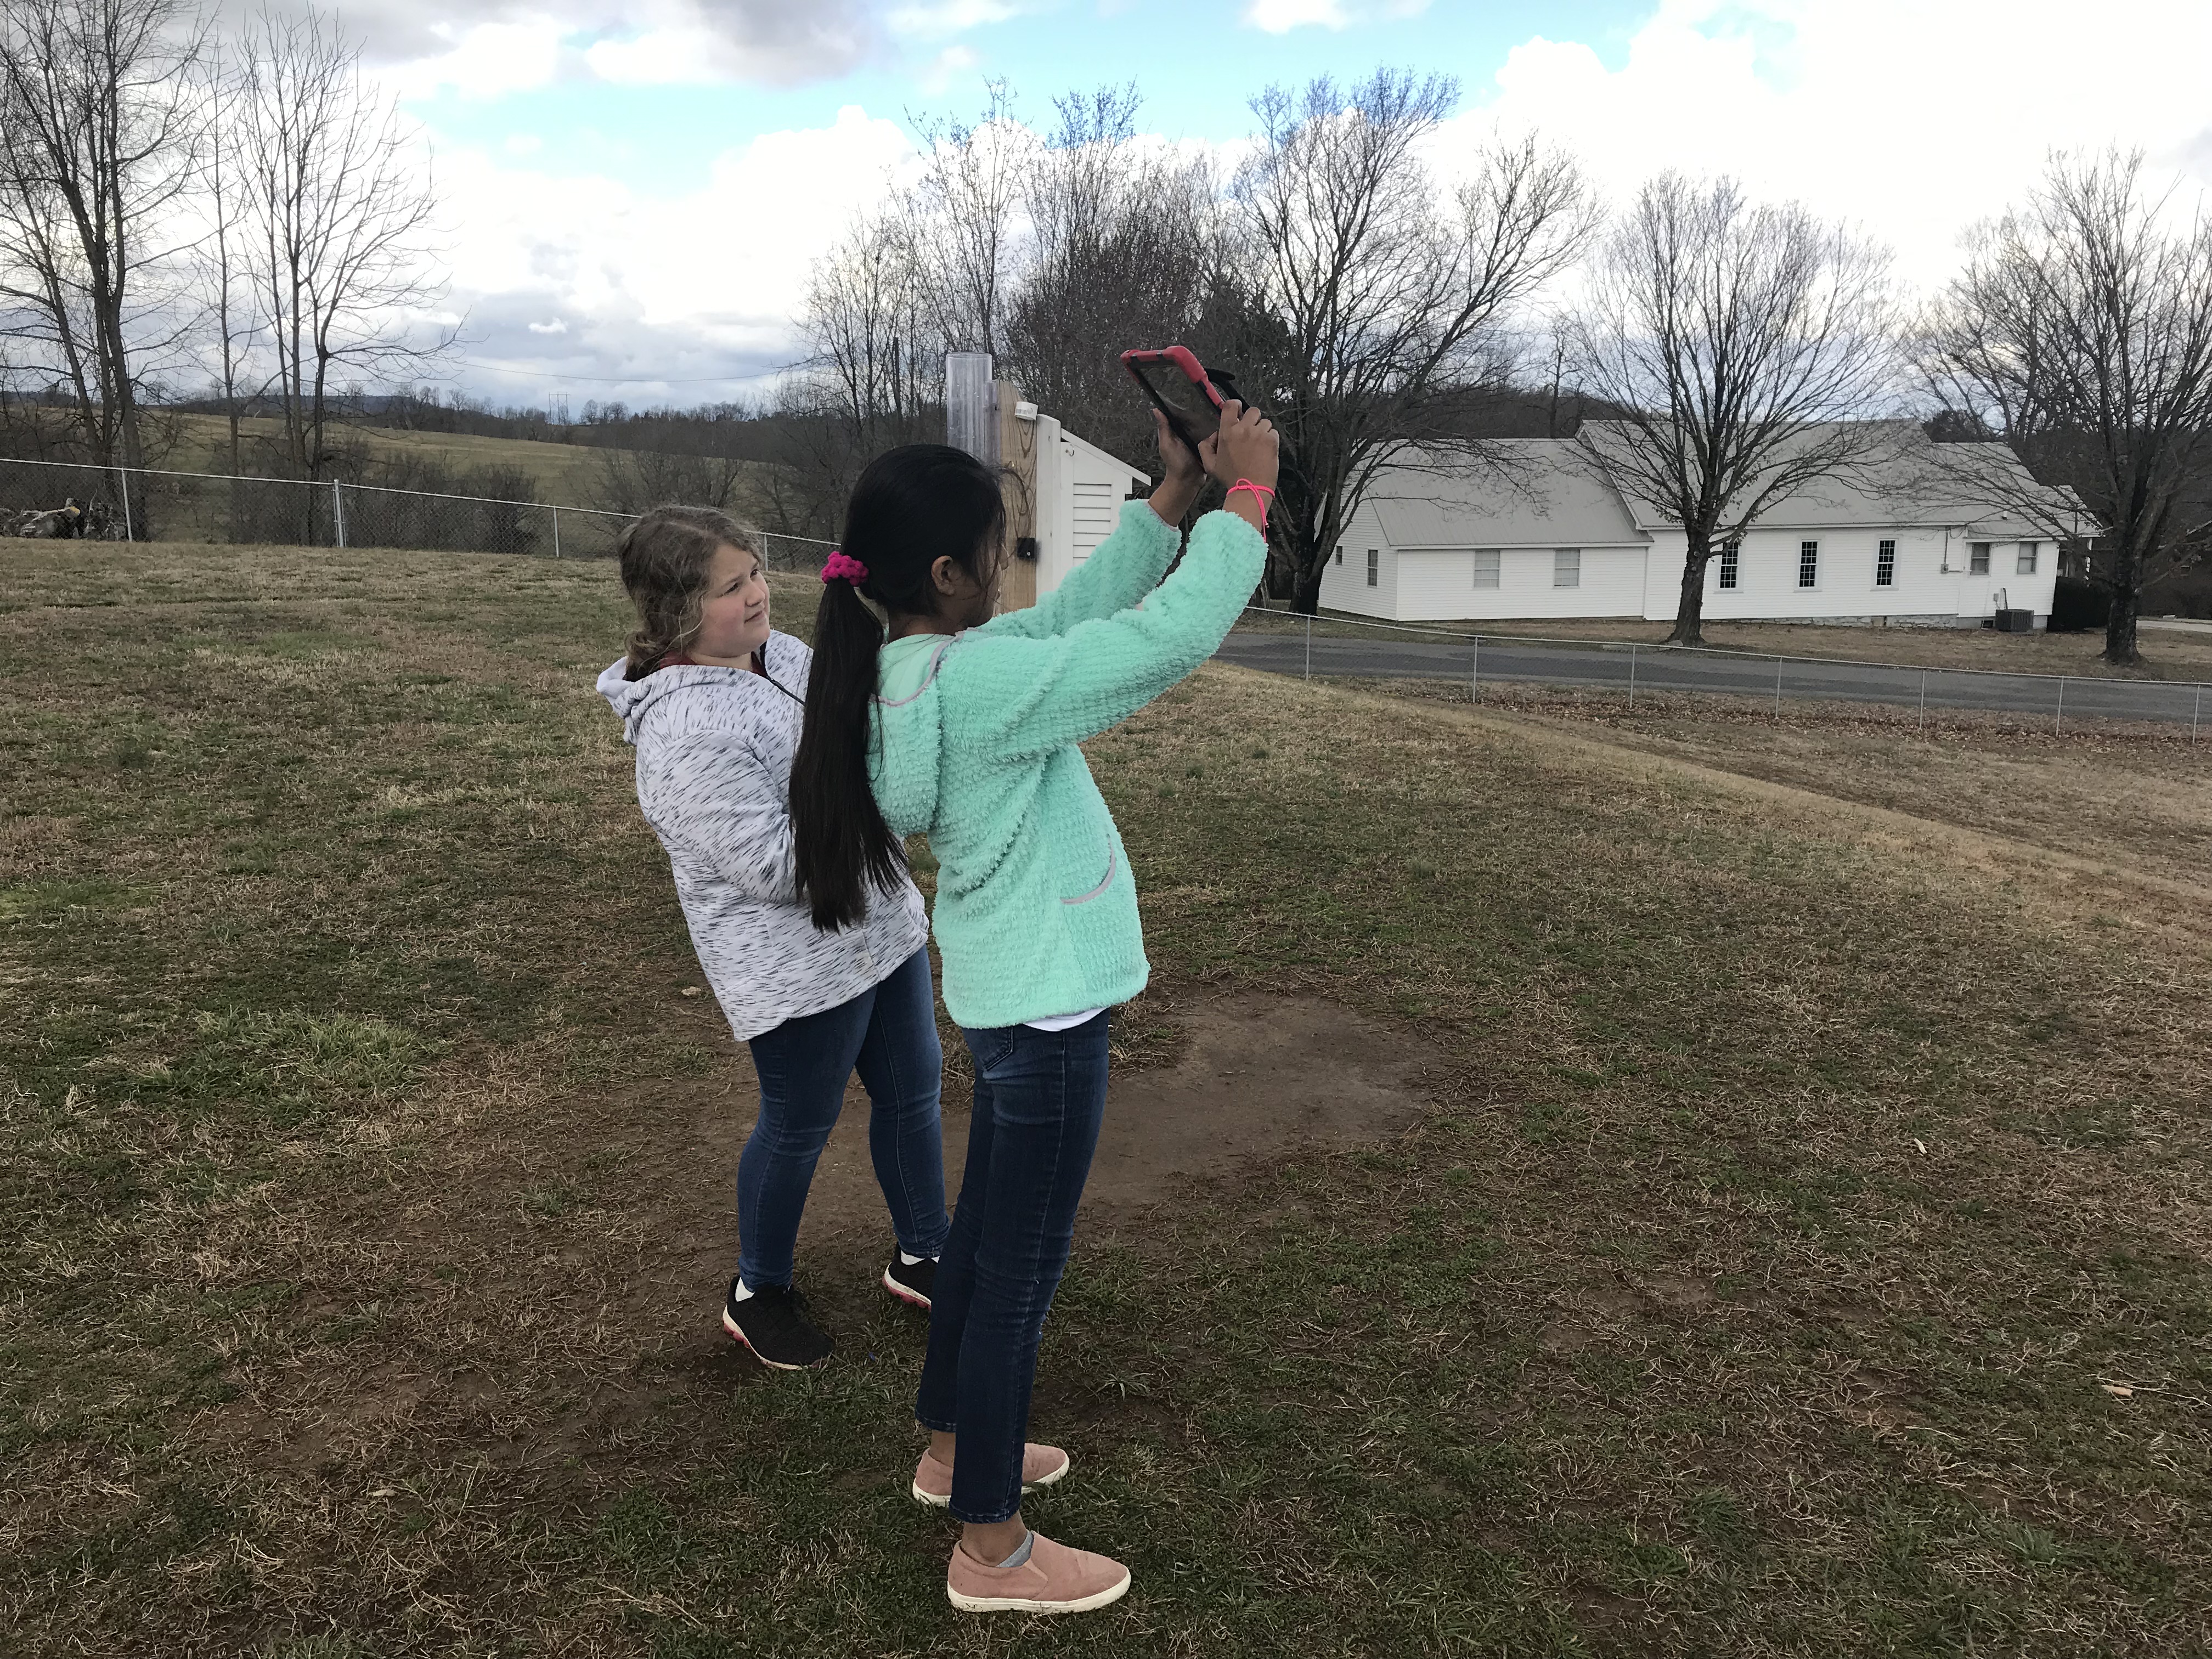
Abstract: "How do the components of the atmosphere, Aerosols, Surface Temperature, and Cloud Cover change during the two-hour solar noon window for GLOBE observations and data collection?" Air and surface temperatures would increase, barometric pressure, relative humidity, and cloud cover would decrease. AOT readings would show a significant difference. During 15 days, the researchers followed GLOBE protocols for observing and collecting data for Aerosol Optical Thickness (AOT), surface temperature, cloud cover, air temperature, relative humidity, and barometric pressure. Data was collected at the beginning of the 2-hour solar noon window, at solar noon and at the end window, then entered into the GLOBE database. Beginning of solar noon AOT: blue=0.080, Green=0.064, red=0.077. Solar noon blue=0.123, Green=0.113, red=0.110. End of solar noon blue=0.068, Green=0.053, red=0.066. Surface temperature beginning=18.5˚C, solar noon =18.7˚C, end=20.3˚C. Air temperature at the beginning=14.6˚C, solar noon =15.5˚C. end=16.4˚C. Relative humidity at the beginning=14.6˚C, solar noon=15.5˚C, end=16.4˚C. Barometric pressure at the beginning=974.3mb, solar noon=973.5mb, end=972.9mb. Cloud cover at the beginning=45.3%, solar noon=45.3%, end=43.3%. 10 days recorded no change in cloud cover, 2 days a 20% change and the 3 days 10% change. As predicted, the air and surface temperatures increased and the barometric pressure, and relative humidity decreased as the window progresses from the beginning of the solar noon window to the close. The cloud over showed little change. The solar noon AOT readings were 58% higher than the beginning and 85% higher than the end of the solar noon window.
Atmosphere Protocols: Atmosphere Protocols: Air Temp, Barometric Pressure, Clouds, Relative Humidity, Surface temp., Aerosol - AOT
Language: English
Video URL: https://youtu.be/tHisi6OQvTc
![]()
![]()
School Name: Alpena Elementary/Middle School
Teacher Name: Roger Rose
Student Name: Bayleigh Jetton & Elizabeth Hernandez
Grade Level: 6
Project Description: A study conducted using GLOBE protocols to analyze how the weather changes during the two-hour solar noon window for data collection.
Abstract: "How do the components of the atmosphere, Aerosols, Surface Temperature, and Cloud Cover change during the two-hour solar noon window for GLOBE observations and data collection?" Air and surface temperatures would increase, barometric pressure, relative humidity, and cloud cover would decrease. AOT readings would show a significant difference. During 15 days, the researchers followed GLOBE protocols for observing and collecting data for Aerosol Optical Thickness (AOT), surface temperature, cloud cover, air temperature, relative humidity, and barometric pressure. Data was collected at the beginning of the 2-hour solar noon window, at solar noon and at the end window, then entered into the GLOBE database. Beginning of solar noon AOT: blue=0.080, Green=0.064, red=0.077. Solar noon blue=0.123, Green=0.113, red=0.110. End of solar noon blue=0.068, Green=0.053, red=0.066. Surface temperature beginning=18.5˚C, solar noon =18.7˚C, end=20.3˚C. Air temperature at the beginning=14.6˚C, solar noon =15.5˚C. end=16.4˚C. Relative humidity at the beginning=14.6˚C, solar noon=15.5˚C, end=16.4˚C. Barometric pressure at the beginning=974.3mb, solar noon=973.5mb, end=972.9mb. Cloud cover at the beginning=45.3%, solar noon=45.3%, end=43.3%. 10 days recorded no change in cloud cover, 2 days a 20% change and the 3 days 10% change. As predicted, the air and surface temperatures increased and the barometric pressure, and relative humidity decreased as the window progresses from the beginning of the solar noon window to the close. The cloud over showed little change. The solar noon AOT readings were 58% higher than the beginning and 85% higher than the end of the solar noon window.
Atmosphere Protocols: Atmosphere Protocols: Air Temp, Barometric Pressure, Clouds, Relative Humidity, Surface temp., Aerosol - AOT
Language: English
Video URL: https://youtu.be/tHisi6OQvTc
0
From Dr. Dixon Butler: I found the topic of your investigation original and creative. You did considerable observational work. Your data presentation was clear and comprehensive, and your graphs are beautiful. How could you expand on your research questions if you did the project again in the Spring?

0
Hello, Bayleigh and Elizabeth,
My name is Larisa Schelkin, I am a GLOBE Partner, GLOBE GISN member and a proud GLOBE educator (https://www.globe.gov/web/larisa.schelkin/home). I am a retired petroleum engineer and an engineering R&D specialist. I now work with K-12 educators in a local non-profit Global STEM Education Center (www.globalstemcenter.org) in Massachusetts. I like the name of your research project! Wow! A “window of opportunity”! You are so creative! Thank you for your great presentation! It's so masterfully done via video! All GLOBE SRS participants can “participate” in your presentation virtually! Your abstract is nicely written, I appreciate your emphasis on the importance of the GLOBE Data and GLOBE Protocols (Atmosphere Protocols: Air Temp, Barometric Pressure, Clouds, Relative Humidity, Surface temp., Aerosol – AOT). Great description (and a great demonstration) of the materials/methods and data sheets in a (nicely put together!) binder. Great hypothesis, great understanding of measurements, data collection and data analysis! And a great conclusion! Your project presentation board looks wonderful! Great pictures, great graphs! I appreciate your double-project-presentation-board (great idea! great format!). It allowed you to have some extra space for your graphs and tables and made your presentation truly outstating! Nicely done! Thank you for all your hard work, your passion, your dedication to working on this research project! Great job!
My name is Larisa Schelkin, I am a GLOBE Partner, GLOBE GISN member and a proud GLOBE educator (https://www.globe.gov/web/larisa.schelkin/home). I am a retired petroleum engineer and an engineering R&D specialist. I now work with K-12 educators in a local non-profit Global STEM Education Center (www.globalstemcenter.org) in Massachusetts. I like the name of your research project! Wow! A “window of opportunity”! You are so creative! Thank you for your great presentation! It's so masterfully done via video! All GLOBE SRS participants can “participate” in your presentation virtually! Your abstract is nicely written, I appreciate your emphasis on the importance of the GLOBE Data and GLOBE Protocols (Atmosphere Protocols: Air Temp, Barometric Pressure, Clouds, Relative Humidity, Surface temp., Aerosol – AOT). Great description (and a great demonstration) of the materials/methods and data sheets in a (nicely put together!) binder. Great hypothesis, great understanding of measurements, data collection and data analysis! And a great conclusion! Your project presentation board looks wonderful! Great pictures, great graphs! I appreciate your double-project-presentation-board (great idea! great format!). It allowed you to have some extra space for your graphs and tables and made your presentation truly outstating! Nicely done! Thank you for all your hard work, your passion, your dedication to working on this research project! Great job!
0
This is an interesting project, and a good question to ask for GLOBE. You have done some great measurements, and have presented your results quite clearly. I particularly like the window in your board! A nice touch!
I am curious about whether your observations and conclusions would be the same at different times of year. I see you made these measurements in the fall, when there was already quite a lot of variation in the weather. Did colder days act differently than warmer days? If you repeated the study in the middle of winter or summer when the weather is (maybe) less variable, might the results be different?
I think it would be interesting to graph the changes for each separate day; and not just the average, to see whether colder or hotter days are different.
Nice work!