Rivers and Lakes Bundle - Earth as a System


Rivers & Lakes Protocol Bundle
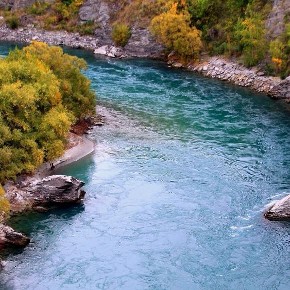
Freshwater is essential for a large portion of life on our planet. Sources of freshwater act as keystone to their surrounding ecosystem and typically include rivers, lakes, wetlands, streams, and underground aquifers. These sources serve as both storage reservoirs and purifying basins for the water crucial to people and wildlife.
Rivers and lakes are especially important sources due to their great water supply and utility to humanity. However, this utility makes these ecosystems particularly vulnerable to human overexploitation and environmental disruption.
Learn more about MyNASA Data and the Rivers and Lakes protocol bundle.
The Many Uses of Freshwater
We use our various rivers and lakes to supply water for drinking, irrigation, manufacturing, energy, and transport. These water bodies also help act as ecological stabilizers by preventing erosion, providing natural protection from flooding, moderating the local climate, and acting as sinks for the waste we dispose into them. The more we negatively impact our rivers and lakes for our own purposes, the less efficient they are at accomplishing their various environmental functions.
Water is recognized by the United Nations as a precondition for human existence and the Earth's sustainability. This recognition serves as a guiding motivation to effectively manage our freshwater resources in order to avoid pollution and water scarcity. This is an especially important undertaking due to the deleterious affects we've had on our wetlands ecosystems. As documented in the 2016 Living Planet Report, there has been an 80% decline in the world's wetlands and the wildlife therein. For perspective, this is twice the reduction seen in our forests and oceans.
Only through careful conservation and further studies the ecological important of wetlands can we begin to both preserve and restore these former habitats. Inside the Rivers and Lakes Bundle, you can find a collection of protocols, prompts, and projects related to these issues and their intersections with various Earth Spheres.
Bundle Overview

- Atmosphere: Climate
- Air Temperature
- Climate change is rapidly warming local air temperatures around the world, and thus, our lakes and rivers as well. Increased temperatures contribute to higher evaporation levels which our threatening our freshwater supplies and ecosystems.
- Relative Humidity
-
Relative humidity (RH) measurements help us understand how quickly water evaporates from Earth’s surface and are important in classifying an area as arid (dry) or humid (moist).
-
- Precipitation
-
Knowing where and how much precipitation falls allows us to estimate the amount of water coming in to freshwater bodies as well as the physio-chemical properties of that body. The seasonal variations in this precipitation are also important factors to consider when planning larger-scale water use.
-
- Air Temperature
- Biosphere: Catchment & Productivity
- Land Cover
-
The land cover surrounding rivers and lakes has a significant influence on the water body as well as of the productivity and quality of the system. For example, open land with no vegetation will experience more erosion, increasing the sedimentation in a water body and affecting how local communities can use that water.
-
- Land Cover
- Hydrosphere: Water Quality/Quantity, Hydrology, & Productivity
- Alkalinity
-
The alkalinity, or amount of calcium carbonate CaCO3, in a body of water determines how well-buffered that water is to pH changes from acidic substance additions. This can have broad impacts for biological productivity in rivers and lakes as well as contribute to the chemical composition of other elements within the water.
-
- Dissolved Oxygen
- Dissolved oxygen (DO) is a vital factor for most aquatic organisms and can influence the type of organisms living in lakes and rivers. For example, although plants and algae contribute oxygen into the water body, excessive overgrowth can lead to lowered DO levels. This is because as these organisms die, bacteria use the water's oxygen to decompose the dead matter, resulting in negative impacts on aquatic life and even dead zones in the water body.
- Electrical Conductivity
-
Electrical conductivity (EC) provides a general measurement of water quality by indirectly measuring how much salt is in the water body. Significant changes in EC can indicate pollution, for example, an oil spill might lower EC while discharged sewage and soil run-off may increase it.
-
- Nitrates
-
In lakes and rivers, nitrogen is considered a "limiting nutrient." This means that influxes or effluxes of this resource can greatly influence the biological productivity of a water body. For example, nitrogenous fertilizer used in agriculture can runoff into rivers and lakes, enriching them in a process called eutrophication. This enrichment can cause a tremendous growth of algae and other plants in the water body, and may create taste/odor problems in our drinking water supply. If nitrogen concentrations become too high, that water will become unfit for human consumption. Furthermore, when these plants die, the bacteria that decompose the plant matter will consume the DO in the water and create oxygen-minimum, or anoxic, zones.
-
- Salinity
-
The salinity of a freshwater body is influenced by the rate of evaporation in the region, so accurate salinity measurements can tell us about the local hydrology as well as changes in climate. It can also inform us of anthropogenic pollution, for example, salinity levels will typically increase when wastewater is discharged into the water body.
-
- Water pH
-
Aquatic organisms have certain pH ranges they prefer or require. For example, animals like salamanders, frogs, and other amphibian life are particularly sensitive to extreme pH levels, so they can serve as important indicators for the health of a lake or river. If the pH drops too low (< 4.0) or raises too high (> 10.0), there's a noticeable absence of most insects, amphibians, and fish.
-
- Water Temperature
- Temperature influences the amount and diversity of aquatic life. Because of temperature variation, the nutrient-rich bottom deep waters mix with the upper waters, bringing vital resources to organisms on the surface. Due to this nutritional overturning, many fish and other aquatic animals have evolved to spawn during the time of year when temperatures rise and food becomes abundant. However, high water temperatures induced by industrial effluent discharge in to rivers and lakes can negatively affect aquatic life by raising temperatures beyond an organism's tolerable range .
- Water Transparency
-
Water transparency affects how deeply light can penetrate the surface of a river or lake. Thus, it's a decisive factor in determining how deep photosynthetic organisms can live within a water body. Transparency can also be used as a pollution indicator when determining human impact on a freshwater body.
-
- Alkalinity
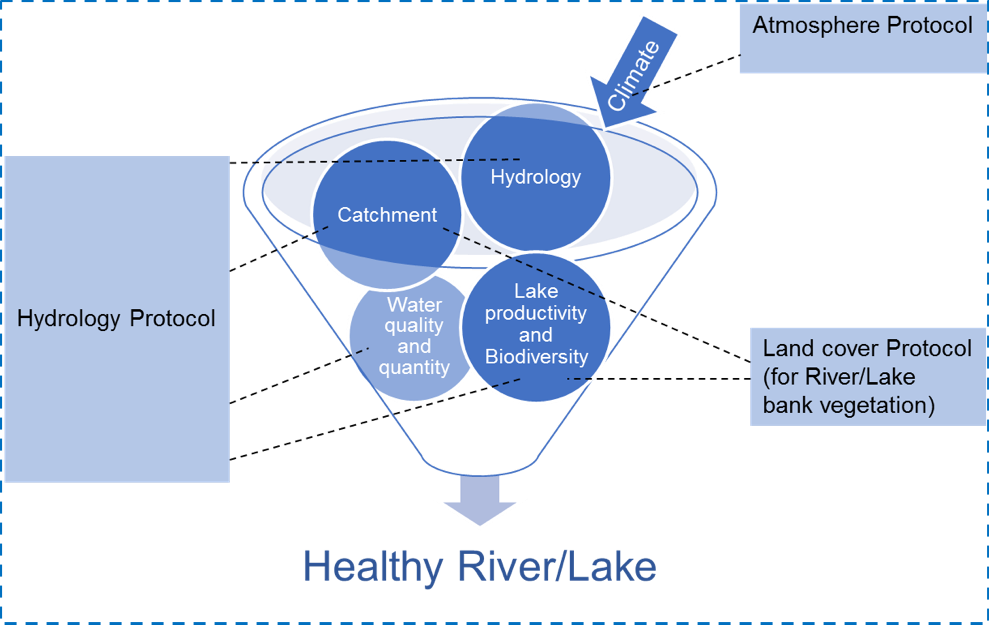
Check out our chart below for a visual representation on how the different protocols Earth Spheres interact:
An Integrated Approach to Freshwater Management
Two-thirds of the world's precious wetlands have been lost in the last century. The drying of rivers, lakes, and wetlands, along with increased pollution, have damaged livelihoods and affected human health. However, if we manage our freshwater assets judiciously, there's a high probability of garnering enough water to meet the needs of both humanity and wildlife. Because of this, we're obligated to protect and manage this vital resource around the world and in our local environments.
In order to most effectively govern our freshwater supply, we need to measure the current environmental status of our rivers and lakes for both their quantity and quality. These measurements will help us identify the factors influencing our freshwater systems as well as guide us in appropriate management techniques. Therefore, these are critical evaluations for conserving this vital asset.
Before taking measurements from rivers and lakes in your local community, it's beneficial to first focus your approach by creating research questions. A few examples of these questions include:
- How does the source of water for your river and/or lake affect it?
- How clean is your river and/or lake?
- What kind of plants and animals live in your river and/or lake?
- What's the temperature, pH, and dissolved oxygen level of your river and/or lake?
- Can you recognize any indications of pollution?
- What are the pollution sources to your rivers and/or lakes?
- How can you contribute to conserve your river and/or lake, and what could be done about it?
- Are there any efforts taken by the local community to protect or restore the rivers and lakes in your area? How do these efforts help improve the quality and/or increase the quantity of water?
To get an idea on how all these different environmental variables are incorporated into the River & Lakes Bundle, check out the following case study trying to answer the questions:
- What is the annual mean temperature of the river Drava in Varazdin and Belisce?
- What are the properties that affect Drava River in the two stations during the year?
- How does river water level affect water temperature and water clarity at these stations?
Note: This study was taken from the GLOBE IVSS project, The Drava River through Miles and Seasons by:
- Students: Nina Gavranović, Sandra Slunjski, Borna Nikolić, Leonora Majstorović, Kristina Puškadija, and Lucija Mađarić
- Teachers: Lidija Tivanovac and Marina Balažinec
- from Schools: Primary School I. Kukuljevića, Belišće and Primary School II. Varaždin
Introduction
Drava is the longest European river. It enters Croatia at Ormoz, and flows into the Danube near Aljmas. The entire length of the flow is 720 km. Annual average flow rate of Drava is 1- 1.5 m/s, it has a relatively fast flow and high mechanical strength, which erodes the coast. It is fed by glacial water regime which means maximum water draft from May to July, lowest draft of water from December to February. Drava is of great importance for two very distant cities - Varazdin and Belisce. This distance attracted us to do joint project. Drava dictates development, location and climate of the cities, which is why we were very interested in this research.
Hypotheses
1. Annual mean temperature of the water will be balanced without major deviations on both the station with minimum temperatures in winter and peaking during the summer months.
2. Small differences are expected in water temperature, the greater the difference on the two stations is expected in the transparency of the water.
3. Water level affects the properties of the Drava river. A higher water level of the river causes less transparency and a lower temperature at both stations.
Research methods
Water and air temperature and transparency of Drava were measured at specific stations along Drava.
Measurements were conducted according to GLOBE Hydrology protocols. The temperature of water and air (an atmosphere protocol) were measured with alcohol thermometers. The transparency of water was measured with the use of the Secchi disk. Furthermore, the National Meteorological and Hydrological Service provided data for water level.
In order to compare the data, measurements were taken the same days of the week at the same time at both stations.
Results and Discussion
The research had a 1-year duration (from 4th October 2014 to 4th October 2015). Measurements were conducted on Saturdays from 13 to 14 hours at stations Varazdin and Belisce.
Chart 1 shows that the transparency of water was much higher at station Varazdin. The measured values were in the range of 10 cm up to 250 cm. The highest values of transparency were measured at the end of December and in January. Transparency was the lowest in October and November.
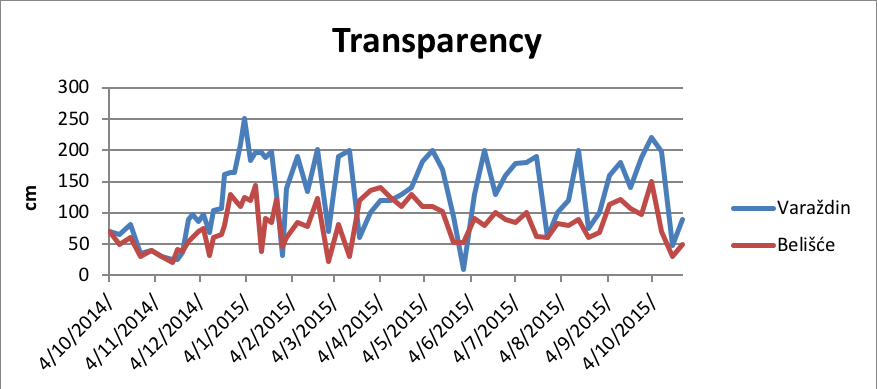
Chart 1. Temporal variation of the transparency of the Drava river at stations Varazdin and Belisce.=
In Chart 2, it is seen that water temperature at both stations match. The temperature maxima were recorded in July and August (Belisce - 27˚C, and Varazdin - 25 ° C). Minimum temperature was recorded in December and February.
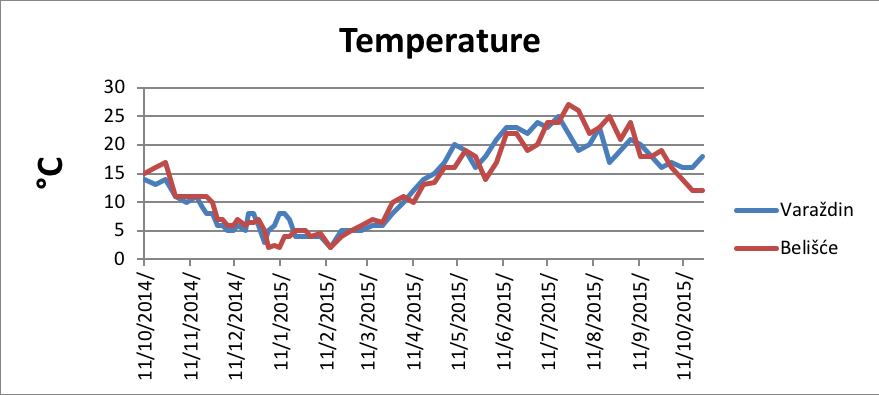
Chart 2. Temporal variation of water temperature of the Drava river at stations Varazdin and Belisce.
Chart 3 shows that the annual mean water level at the station Varazdin is uniform while at the station Belisce there are leaps in the winter and summer months. The highest measured values were 412 cm and 250 cm at Belise and Varazdin respectively. The lowest values were 95 cm in Belisce and 76 cm in Varazdin.
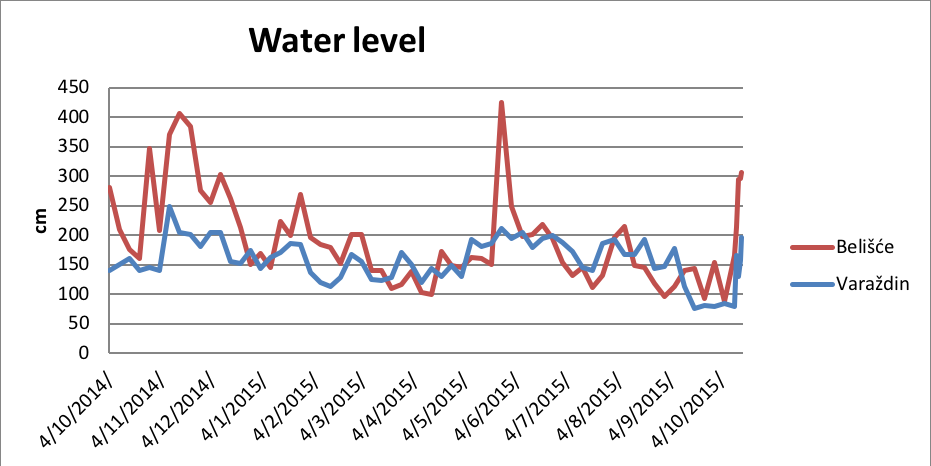
Chart 3. Temporal variation of water level of the river Drava at stations Varazdin and Belisce.
Charts 4 and 5 present the temporal variations of water level and transparency in both river measuring stations. It is clearly seen how water level affects the transparency of the water as the higher the water level, the less transparency of water and vice versa.
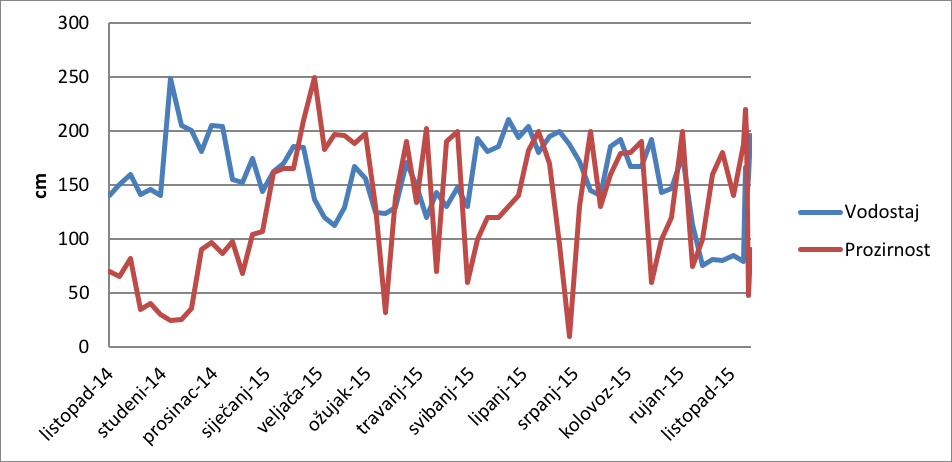
Chart 4. Graphic view of impact of water levels (Blue line) on transparency (Red line) at the station
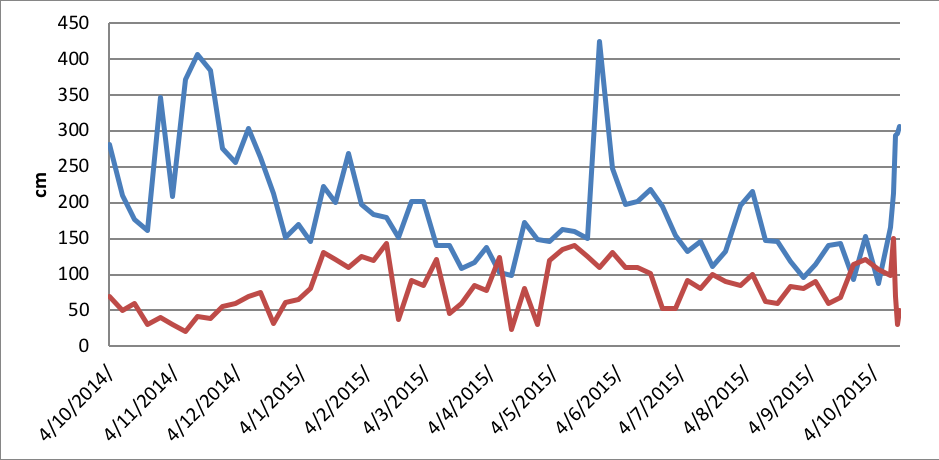
Chart 5. Graphic view of impact of water levels (Blue line) on transparency (Red line) at the station Belisce.
Charts 6 and 7 present the temporal variation of water level and water temperature for both measuring stations. An inverse proportionality of the water temperature and water level was observed throughout the year. Practically, when water level increases, water temperature decreases and vice versa.
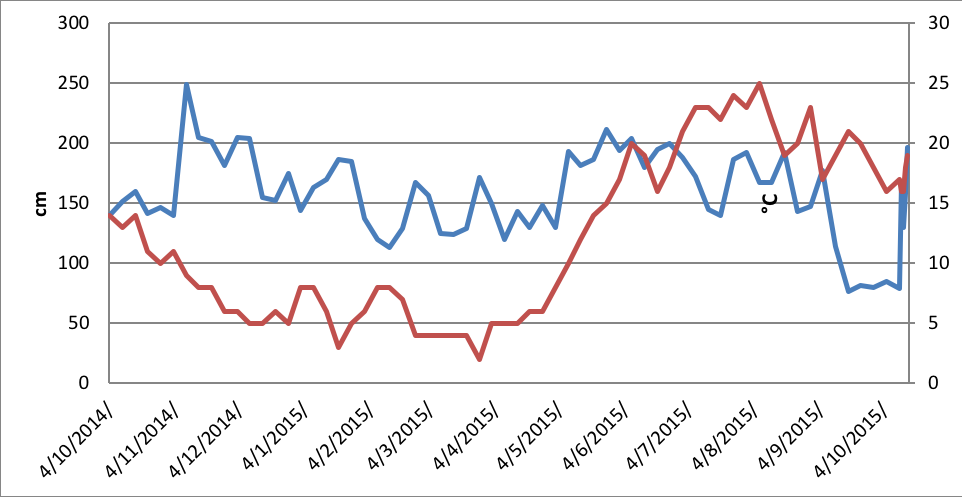
Chart 6. The dynamics of the water level (red line) and water temperature (blue line) at the station Varazdin
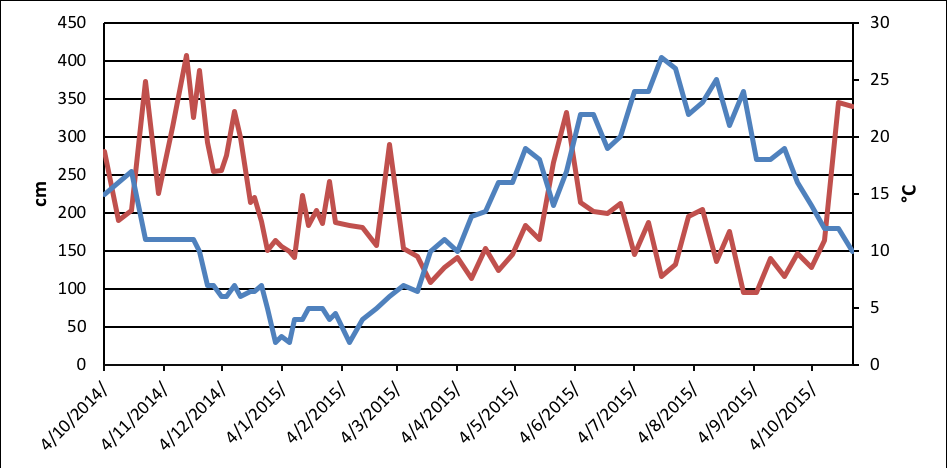
Chart 7. The dynamics of the water level (red line) and water temperature (blue line) at station Belisce.
Conclusions
(a) The increase in water temperature is associated with an increase in solar radiation and thus the temperature of air. In summer and autumn months, water temperature was slightly higher at the station Belisce while in spring and winter temperatures were the same in both stations. The reasoning about the slightly higher temperatures at the station Belisce in the summer and autumn months may be the altitude difference (Varazdin-169-173n / m; Belisce- 91-93n / m).
(b) Water transparency data show higher values at the station Varazdin. This may be because of the sandy and muddy ground on the station Belisce and greater erosion of the surrounding soil while the river is passing through the township. The highest values of transparency were recorded in December and January when the water level and productivity decreased.
(c) From the results of the research, it was found that the water level affects the temperature and water transparency at both stations. At the station Varazdin stable water level can be linked to hydro powers in the area that regulate the amount of water, but also reduce amount of sediment (Bonacci, 2006).
Higher water levels were recorded at Belisce with two maximums in the late spring and summer (snow melting) and late fall due to heavy rainfall. Minima are in winter and in September when there is no melting of ice in the Alps. At station Belisce, there is less transparency due to high water levels and muddy and sandy substrates.
Citizen scientists play a very important role in complementing this effort. The study of rivers and lakes are typically covered under the discipline of hydrology, however, these water bodies are formed and regulated by complex processes both in the atmosphere and the land around them. Because of these interdependent relationships, we need a more holistic approach like that found in the Rivers and Lakes Bundle to further our understanding of the interactions happening in our freshwater sources.
As a GLOBE student, be assured that your measurements provide valuable input for researchers and organizations monitoring, protecting, and restoring rivers and lakes in your local community. By uploading your freshwater data to GLOBE's databases, you become part of the effort to support global initiatives to sustainably manage our freshwater resources.
References
GLOBE Hydrology protocol and atmosphere protocol
Bonacci O, Oskoruš D. 2006. The influence of three croatian hydroelectric power plants operation on the river drava hydrological and sediment regime, Faculty of Civil Engineering and Architecture, Split University
http://www.obz.hr/hr/pdf/zastitaokolisa/Osnova%20obiljezja.pdf
http://www.dzzp.hr/dokumenti_upload/20100423/dzzp201004231344260.pdf