Happy Earth Day Everyone!
Leaves on many of your trees are already unfolded, so it is time to enter your data into the GLOBE database. We believe that you will find it easy when using a guide that we prepared for you as a part of Task 4. In this task, you will also try some of the awesome things you can do with the GLOBE Visualization Tool.
Have fun visualising and comparing your data. And thank you for sharing your results in the Discussion forum!
LenkaTask 4 – My Data
1) Upload your data to globe.gov website
To share the data with other schools and see a graph of your leaf growing in time, upload the data to the GLOBE website. It is not complicated, just give it a try.
- Follow the guide we prepared for you.
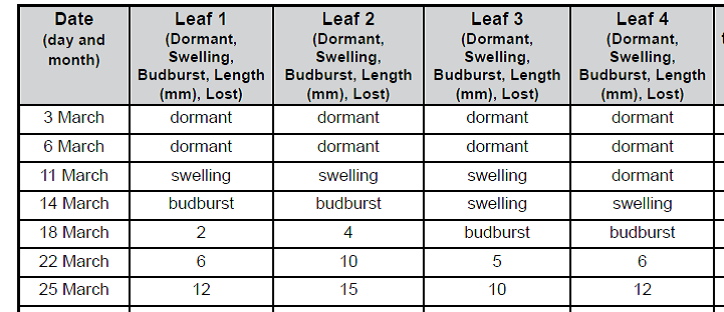
- You need the data that you collected at Task 1, 2 and 3.
![]()
2) See the graph of your tree budburst at the GLOBE Visualization tool
Once your data are uploaded correctly you can do amazing things:
- See the data on the world map linked to your school
- Draw a graph with your data and print it out
- Compare data from different locations – in graph and spreadsheet
It is easy. If you are not familiar with the Visualization tool, please see the video guide.
https://www.globe.gov/get-trained/using-the-globe-website/retrieve-and-visualize-your-data 3) Compare your data to the data of another school at the GLOBE Visualization tool- Filter out the Green Up data from schools in your country or any other location
- Compare the same species and see if the budburst date was the same or different
- Ask students to come with a hypothesis why the budburst date differs. Let them find out more about the specific conditions of the site where the tree grows (latitude, longitude, elevation, air temperature, precipitation)
4) Share your graph in the Discussion forum. Comment on how your data differ from data of other schools. We are here to help you. If you have any technical issue when uploading the data and working with Visualization tool, please contact us at europe@globe.gov. Most of the problems can be solved by one or two more clicks! We will tell you how to do it
 And do not forget to continue measuring the length of the leaf and taking pictures with GrowApp!
Please complete the task up to May 15.
---


