Blogs

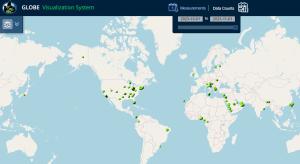
The urban heat island intensive observation period (IOP) this October yielded about 25% more observations than last year. I only look at surface temperature observations since that is the protocol that I developed (with help from others) and there are many other air temperature and cloud observations in the GLOBE database that are not part of the urban heat island IOP. This October there were a...


Posted in: Field Campaigns: Surface Temperature GLOBE Science Topics: Climate Investigation Areas: Atmosphere

A video of me talking about the IOP is here: https://youtu.be/gAwHjoCJNe0 The GLOBE October Intensive Observation Period (IOP) for urban heat island had great data collecting from around the world. Data was collected by students at over 70 schools and 1471 observations of surface temperatures wee taken. A list of all of the schools is listed below. Here is a map and a picture from Earth...


Posted in: Curriculum: STEM Field Campaigns: Surface Temperature

GLOBE completed another great month of the Urban Heat Island (UHI) Intensive Observation Period (IOP) in March 2022. 107 schools participated and took a total of 1699 observations throughout the month. It is great to see more and more schools becoming active in this very important project. UHI is becoming more and more important around the world. Saudia Arabia, Croatia, Greece and Taiwan had...


The Urban Heat Island Effect Intensive Observation Period (IOP) has started. The weather in the Northern Hemisphere has started to get warmer as meteorological spring started March 1. There was an amazing weather situation where I live this past Saturday. You can see in the images on the left that I drove about 20 miles (32 km) from my house in Michigan to the Oak Openings Park in Ohio. There...


In the Toledo area, Dr. C and schools in the area focused on studying artificial turf versus grass soccer and football fields. Artificial turf was much warmer than natural grass. This is combining the GLOBE Urban Heat Island Field Study with research by Vasco Mantas from the University of Coimbra in Portugal and George Xian from the USGS Eros Data Center and the AREN Project with Andy Henry and...


Posted in: Field Campaigns: Surface Temperature Investigation Areas: Atmosphere » Surface Temperature Student Research Reports: U.S. Student Research Symposia (SRS) Mission Earth Report

It snowed at my house in Michigan last week, the first week of December 2020. I love snow and I really like to see how snow affects the surface temperature. Between 60 and 80 mm of snow was on the ground. I took surface temperature observations as part of the Urban Heat Island Student Research Campaign. I wanted to show what you could do by yourself at your house if you have an infrared...


Posted in: Field Campaigns: Surface Temperature

Even with the pandemic, participation the campaign has been good. Although the number of schools participating and the total number of observations was down from last year, it was still a nice number of each. So far this fall (Northern Hemisphere) spring (Southern Hemisphere) there have been over 3,500 observations from 135 sites (70 schools) across the world. Please see the list below. There...


Posted in: Field Campaigns: Surface Temperature

GLOBE Mission EARTH has posted videos in the NSF funded STEM for All video showcase. The NASA funded project I lead that fuses GLOBE projects with NASA assets put a couple videos in. Our video highlights students who chose STEM careers. Please take some time this week, May 5-12, 2020, to watch the videos. Please make a comment or vote for your favorite video.  Here is our project: GLOBE...


The GLOBE Urban Heat Island Student Research Campaign finished up the 2019-2020 campaign with observations from 254 sites in October with 6,688 surface temperature observations. In December, 4,248 observations were taken from 126 schools. Over 50% of the data was submitted in the last 2 weeks. This is a large increase from last year of about 150%. There are focus areas with many schools...


Do you want to learn how to take surface temperature observations? The students at the Toledo Public School Natural Science Technology Center (NSTC) show how it can be done in this short video.  https://www.facebook.com/globemissionearth/videos/2581539525466417/ December is the second month of Urban Heat Island Effect Research Campaign. Take as many observations in the month of...