
Figure 1 shows how Earth’s average temperature has changed over time from two research groups – one the National Climate Data Center in the United States, and the second from the Climate Research Unit at the University of East Anglia in the United Kingdom.
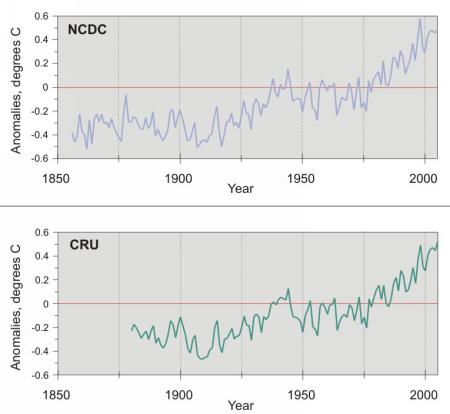
Figure 1. Thermometer-based global average temperature as a function of time, plotted relative to the average between 1960 and 1990. This includes land and ocean. From the NOAA Web page.
In both graphs, temperatures are compared to the 1960-1990 averages. Any temperature below the red “zero” line is cooler than that period, and any temperature above the red “zero” line is warmer. The temperature records are carefully chosen to avoid too much influence of the warming of cities (see previous blogs on the urban heat island), changes in thermometers at a given site, changes of measurement locations, and other changes that influence local temperature. And, because oceans cover 70% of Earth’s surface, extra care is taken in analyzing sea surface temperature data from ships. You can find more information about how temperature data are treated in a 1990 Scientific American article by Philip D. Jones and Tom M.L. Wigley (pp 84-91). A graph of surface air temperature relative to the 1951-1980 mean, from the Goddard Institute for Space Studies (GISS), shows similar trends (Figure 2). In this case, satellite-based sea-surface temperatures are used from 1982 on.
The graphs are for Earth’s yearly average temperature at about 1.5 m above the surface (the height temperatures are measured by weather services, and the height at which GLOBE students take their temperature observations, see Instrument Construction from the Teacher’s Guide, p 14). That includes the land, which covers 30% of the surface, and the ocean, which covers 70% of the surface.
The GISS graph in Figure 2 includes the temperature departures from the 1951-1980 averages. You can see that some places – like the Arctic, are much warmer than that average. And some paces, like parts of the high latitudes in the Southern Hemisphere, are actually cooler.
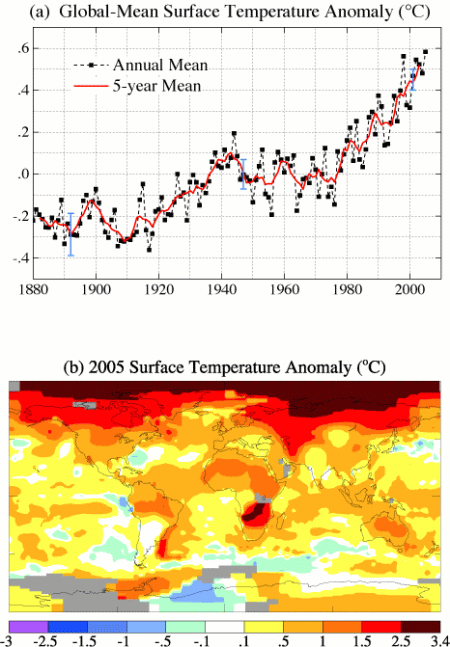
Figure 2. (Top) temperature departure from 1951-1980 mean as a function of time. (Bottom) map of temperature departure from 1951-1980 mean for 2005. Source: Goddard Institute for Space Studies. Numbers are degrees Celsius.
We tend not to remember averages, though. We remember hot days, or cold days, or storms, so we (even scientists!) are tempted to think that a hot day means “global warming” and a record low means that “global warming” isn’t happening. That is why looking at graphs of average temperature data is helpful. The graph enables us to study the patterns in climate data which represent average weather over time.
What is the difference between weather and climate? In the words of a middle-school student, “Weather helps you decide what to wear, and climate helps you decide what clothes to buy.”
Next: What affects Earth’s climate?
Yes but does this really mean that we are in global warming. We only have approximately the last 160 years of data. It seems like quite a small bit of data compared to how long the earth has been in existence. I mean we have gone through ice ages and how do we know we are still coming out of the last ice age?
Thanks
Cosmetic Surgeon
The data presented here of course refers to the last 160 years. There have been analyses of data for the last 1000 years; the plot has been referred to as the “hockey stick” because the warming of the last 100 years or so shows up like the business end of a hockey stick. So careful analysis of data back that far gives a similar answer.
Several people were skeptical about the hockey stick, so the National Academy of Sciences convened a study to look into the plot further, and the results expressed confidence to around 500 years or so, with the error bars not surprisingly getting bigger before that.
And you are right — there have been warming episodes in the the past, particularly looking at geologic time. At the end of the Permian, during the Cretaceous, and between the Paleocene and Eocene, there were warm episodes as well. As you will see from future blogs, the causes of these warming event are thought to be from greenhouse gases, probably emitted by massive eruptions but possibly also released from clathrates under the ocean. I’ve seen evidence of carbon dioxide levels about 10 times as much as today’s level during the late Permian.
More recently, ice ages and warming episodes have been linked to changes in the earth’s tilt and orbit.
As noted, I plan to deal with some of these issues in later blogs.
Hi.
I agree. The situation is critical! I\’m (only) 27 and I really noticed a big difference in the weather since the last 20 years. I checked the weather forecast for next week and we will have a scary 36 degrees here in Montreal. It\’s crazy! I never ever saw that before and unfortunately, we will brake another record…
Alex
It does seem there are more record-breaking hot days. We have lived in the same house for 30 years and it is not air-conditioned. Every year it seems to be harder to keep it cool (typically we close up during the day, and open the windows when the outside temperature is lower than the inside temperature). A single hot day is easy to handle, but the a hot week makes it harder.
I\’m not an expert in this subject, so only my observations, but over the last few years it seems as if our weather (Colorado) patterns have been extremely erratic. I read somewhere that \”the overall warming\” of the planet could cause such erratic weather patterns. Is there any truth to this?
Thanks
Logan Chierotti
Hi Logan
I have heard similar claims, but am not sure that we can say for sure.
I recently read an article that referred to animals encountering more variability when emerging in the spring up at Rocky Mountain Biology Lab in Gothic, but this could be variability associated with the winter pattern sticking around.
I have emailed a climate expert here at UCAR to see if he has a better answer.
Peggy
Hi Logan,
I looked further into climate variability last night by scanning Chapter 3 of the recent report by the International Panel on Climate Change. This document tries to summarize the relevant work — quite an ambitious task.
I found that high-temperature extremes are becoming more common in parts of the world — consistent with a warmer *average* temperature, with fewer low-temperature extremes. A talk I heard from an Australian confirmed that result for that country. The distribution of temperatures looked about the same — it had just shifted — so there was essentially the same variation about a warmer average.
Precipitation seems to be somewhat different. With warmer temperatures, there is more water vapor in the atmosphere. With more water vapor to work with, the atmosphere can produce more heavy rainstorms, and this seems to be happening. Also, there seems to be some more persistent droughts.
One interesting thing that is noted in Chapter 3 is that more news coverage has increased our awareness of extreme weather events, so that even with no change — we might think there is more. This is kind of what I was talking about in the blog “Are there more storms?” — there was a jump in tornado occurrence when recording severe storms become more formalized.
I’m not sure about the wind patterns. There are many sources of natural variability as well, and I’m not sure the wind pattern has been teased out of the natural variability yet.
Hope this helps!
Best regards,
Peggy
My observations from NewZealand are the same. We have been hit recently by floods, one after the other. We have had a number of Tornadoes striking the Taranaki region. We have never heard of this happening before.
We have a very thin ozone layer above us and this has also contributed to the rise of skin cancers and eye problems. We are warned to wear hats, sunglasses and sunblock during the summer. However even during the winter i am finding some days you can get burnt. Last summer we saw rain almost every day. Is this due to the global warming Peggy?
Thanks
John
Hi John,
It’s hard to say. Individual sets of events could have a number of causes. Periods of rain and dry weather in many parts of the worls are related to longer-lasting weather patterns in the Pacific (like El Nino) and Atlantic. I.e., it could have happened without global warming, but of course we don’t really know, because we can’t look at what the weather would have been like in New Zealand without global warming.
However, the thinning of the ozone layer is largely due to the release of chlorofluorocarbons, which were used in spray cans, refrigerators, etc. We thought at the time they were introduced that they were marvelous because of their safety. (e.g., another refrigerant, ammonia, was quite dangerous, and people — including the father of a friend of mine — died as a result. Fortunately, the release of CFCs has slowed down dramatically, but it will take a long time for the CFCs in the atmosphere to decrease.
The fact that chlorofluorocarbons (CFCs) are so stable contributed to their being able to arrive at the ozone level, where they are responsible for destroying alot of ozone, particularly in the high southern latitudes.
Because both ozone and CFCs are greenhouse gases, they are affecting temperatures as well, particularly above the surface.
Hope this helps! I’m writing this late on a Friday afternoon!
Cheers,
Peggy
Pingback: Climate Change - Overview - GLOBE.gov
Sad to say, it’s getting worse everyday especially on tropical countries. You can no longer distinguish the summer heat to other seasons. Around 7-8am it’s so hot that you really need to wear your sunglasses or else your eye surface will be damaged that could lead to cataracts. For the skin, it’s essential to put SPF lotions and the like to protect it from severe damage that could lead to skin cancer. With the changes in the temperature, albino people suffer a lot as they lack protection on their skin.