
As Dr. C wrote during his Surface Temperature Field Campaign, the weather in mid-December was cold in many parts of the United States. At our house here in Boulder, Colorado (Figure 1), this morning’s minimum temperature was -21 degrees Celsius. Just 20 kilometers east of here, the minimum temperatures was 27 degrees Celsius below zero, and about 50 km to the southeast of here, the minimum temperature reached -28 degrees Celsius. The weather reports were saying that those of us who live closer to the mountains weren’t having temperatures as cold as those to the east of us.

Figure 1. Map showing location of Boulder and CASES-99. The colors represent contours. The Rocky Mountains are yellow, orange, and red on this map. The colors denote elevation, with yellows, oranges and reds indicating higher terrain.
How does the air temperature relate to the surface temperatures that the students measured during Dr. C.’s field campaign? To answer this question, I looked at how the surface temperature related to the air temperature at our house.
The air temperature at our house was measured at 1-1.5 meters in our carport, and also on a thermometer I carried with me on our early-morning walk around the top of our mesa. That temperature, as noted above, was -21 degrees Celsius. To get the surface temperature, I put the thermometer I was carrying on the surface after I finished my walk. I am assuming that this temperature is close to the temperature that would be measured by a radiometer like the one used in GLOBE. I took the reading ten minutes later.
Just for fun, I also measured the temperature at the bottom of our snow (now 10 cm deep) and at the top of the last snow (about in the middle of the snow layer). At these two places, I put the snow back on top of the thermometer, waited ten minutes, and then uncovered the thermometer and read the temperature. The new snow was soft and fluffy, while the old snow was crusty; so it was easy to find the top of the old snow.
All of the measurements were taken close to sunrise, when the minimum temperature is normally reached, and the area where I took the measurements was in the shade.
Figure 2 shows the temperatures that I measured.
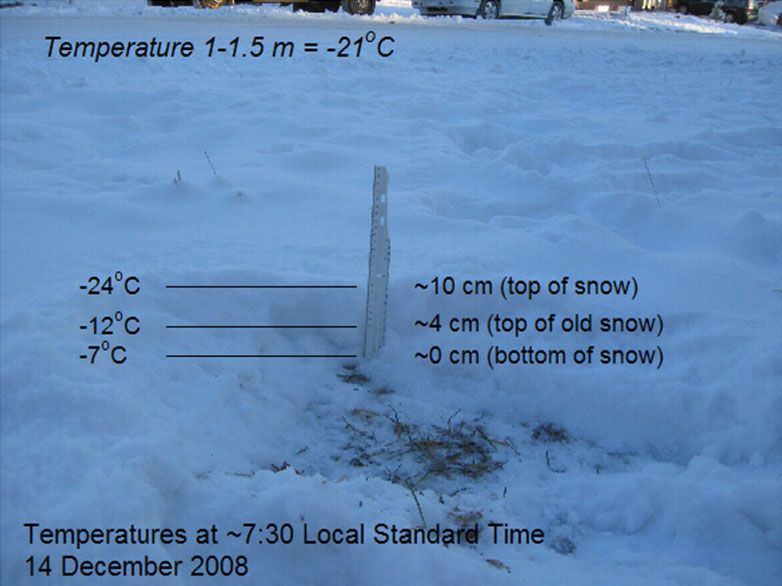
Figure 2. Temperature measurements at the snow surface, between the old and new snow, at the base of the snow layer, and at 1-1.5 meters above the surface at 7:30 in the morning, local time.
That is, the temperature was coolest right at the top of the snow. The temperature was warmer at the top of the old snow, and warmest at the base of the snow. As noted in earlier blogs, the snow keeps the ground warm.
The temperature at the top of the snow was also cooler than the air temperature. The surface temperature is often cooler than the air temperature in the morning, especially on cold, clear, snowy mornings like this one. However, on hot, clear, days in the summertime, the ground is warmer than the air.
Here are two sets of measurements taken in the Midwestern United States in October of 1999. Could you guess which measurements were taken at night, and which measurements were taken during the day even if the times weren’t on the labels? The first plot is from data taken after sunset, while the second plot was from data taken at noon.
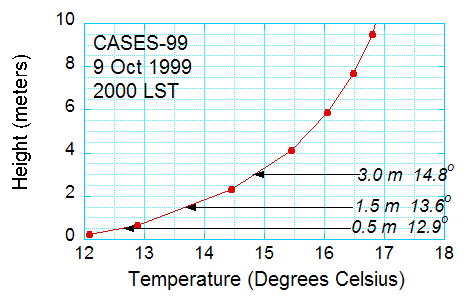
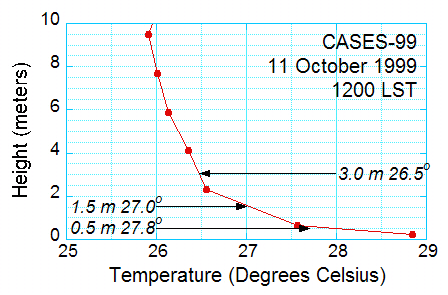
Figure 3. Data from the 1999 Cooperative Atmosphere Exchange Study (CASES-99) program in the central United States, courtesy of J. Sun, NCAR.
Thanks for article. Now I know more good info aboute Relating Air Temperature