
For years, I have been measuring the rain in our back yard using a standard rain gauge similar to the ones used by the U.S. National Weather Service (Figure 1). Like the gauge used by GLOBE students, rain goes through a funnel into a tube whose horizontal cross-sectional area is one-tenth that of the outer gauge, so that the measured rain is ten times the actual amount of rainfall. This year, I took a GLOBE-approved plastic gauge home. We put this one on a fence along the east side of our yard (Figure 2).
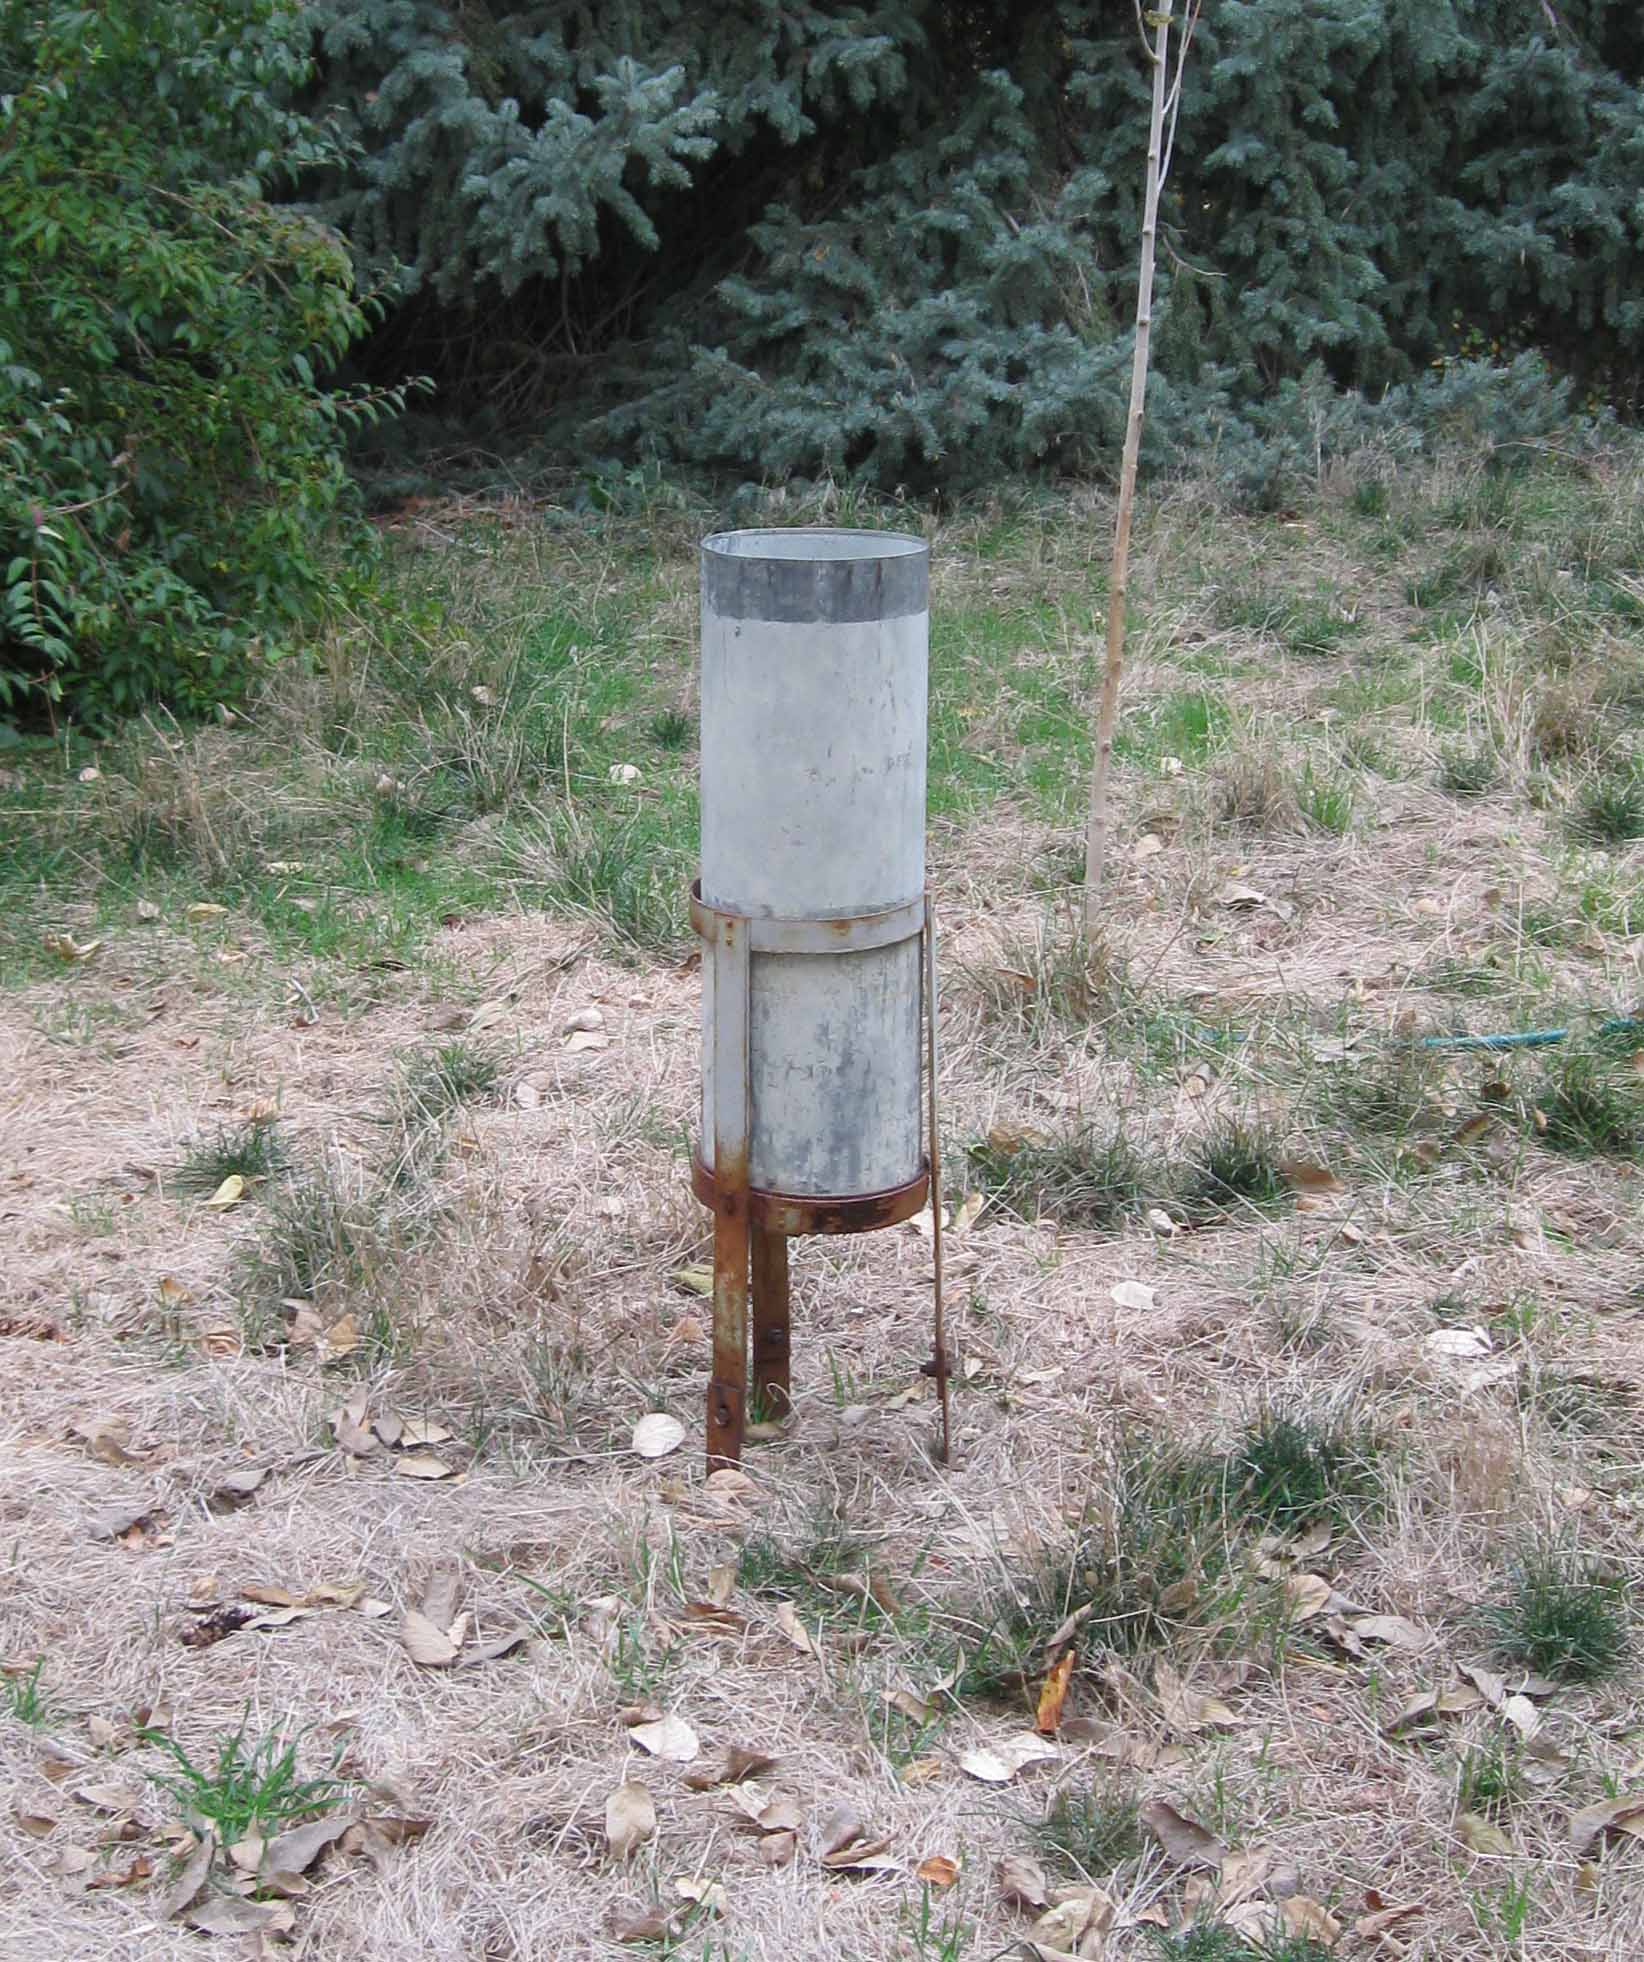
Figure 1. Rain gauge used for observations in my backyard. Normally, there is a funnel and small tube inside, but it doesn’t fit very well, so we pour the rain into the small tube after each rain event. This gauge is similar to those used by the U.S. National Weather Service. This gauge is about 25 cm in diameter.
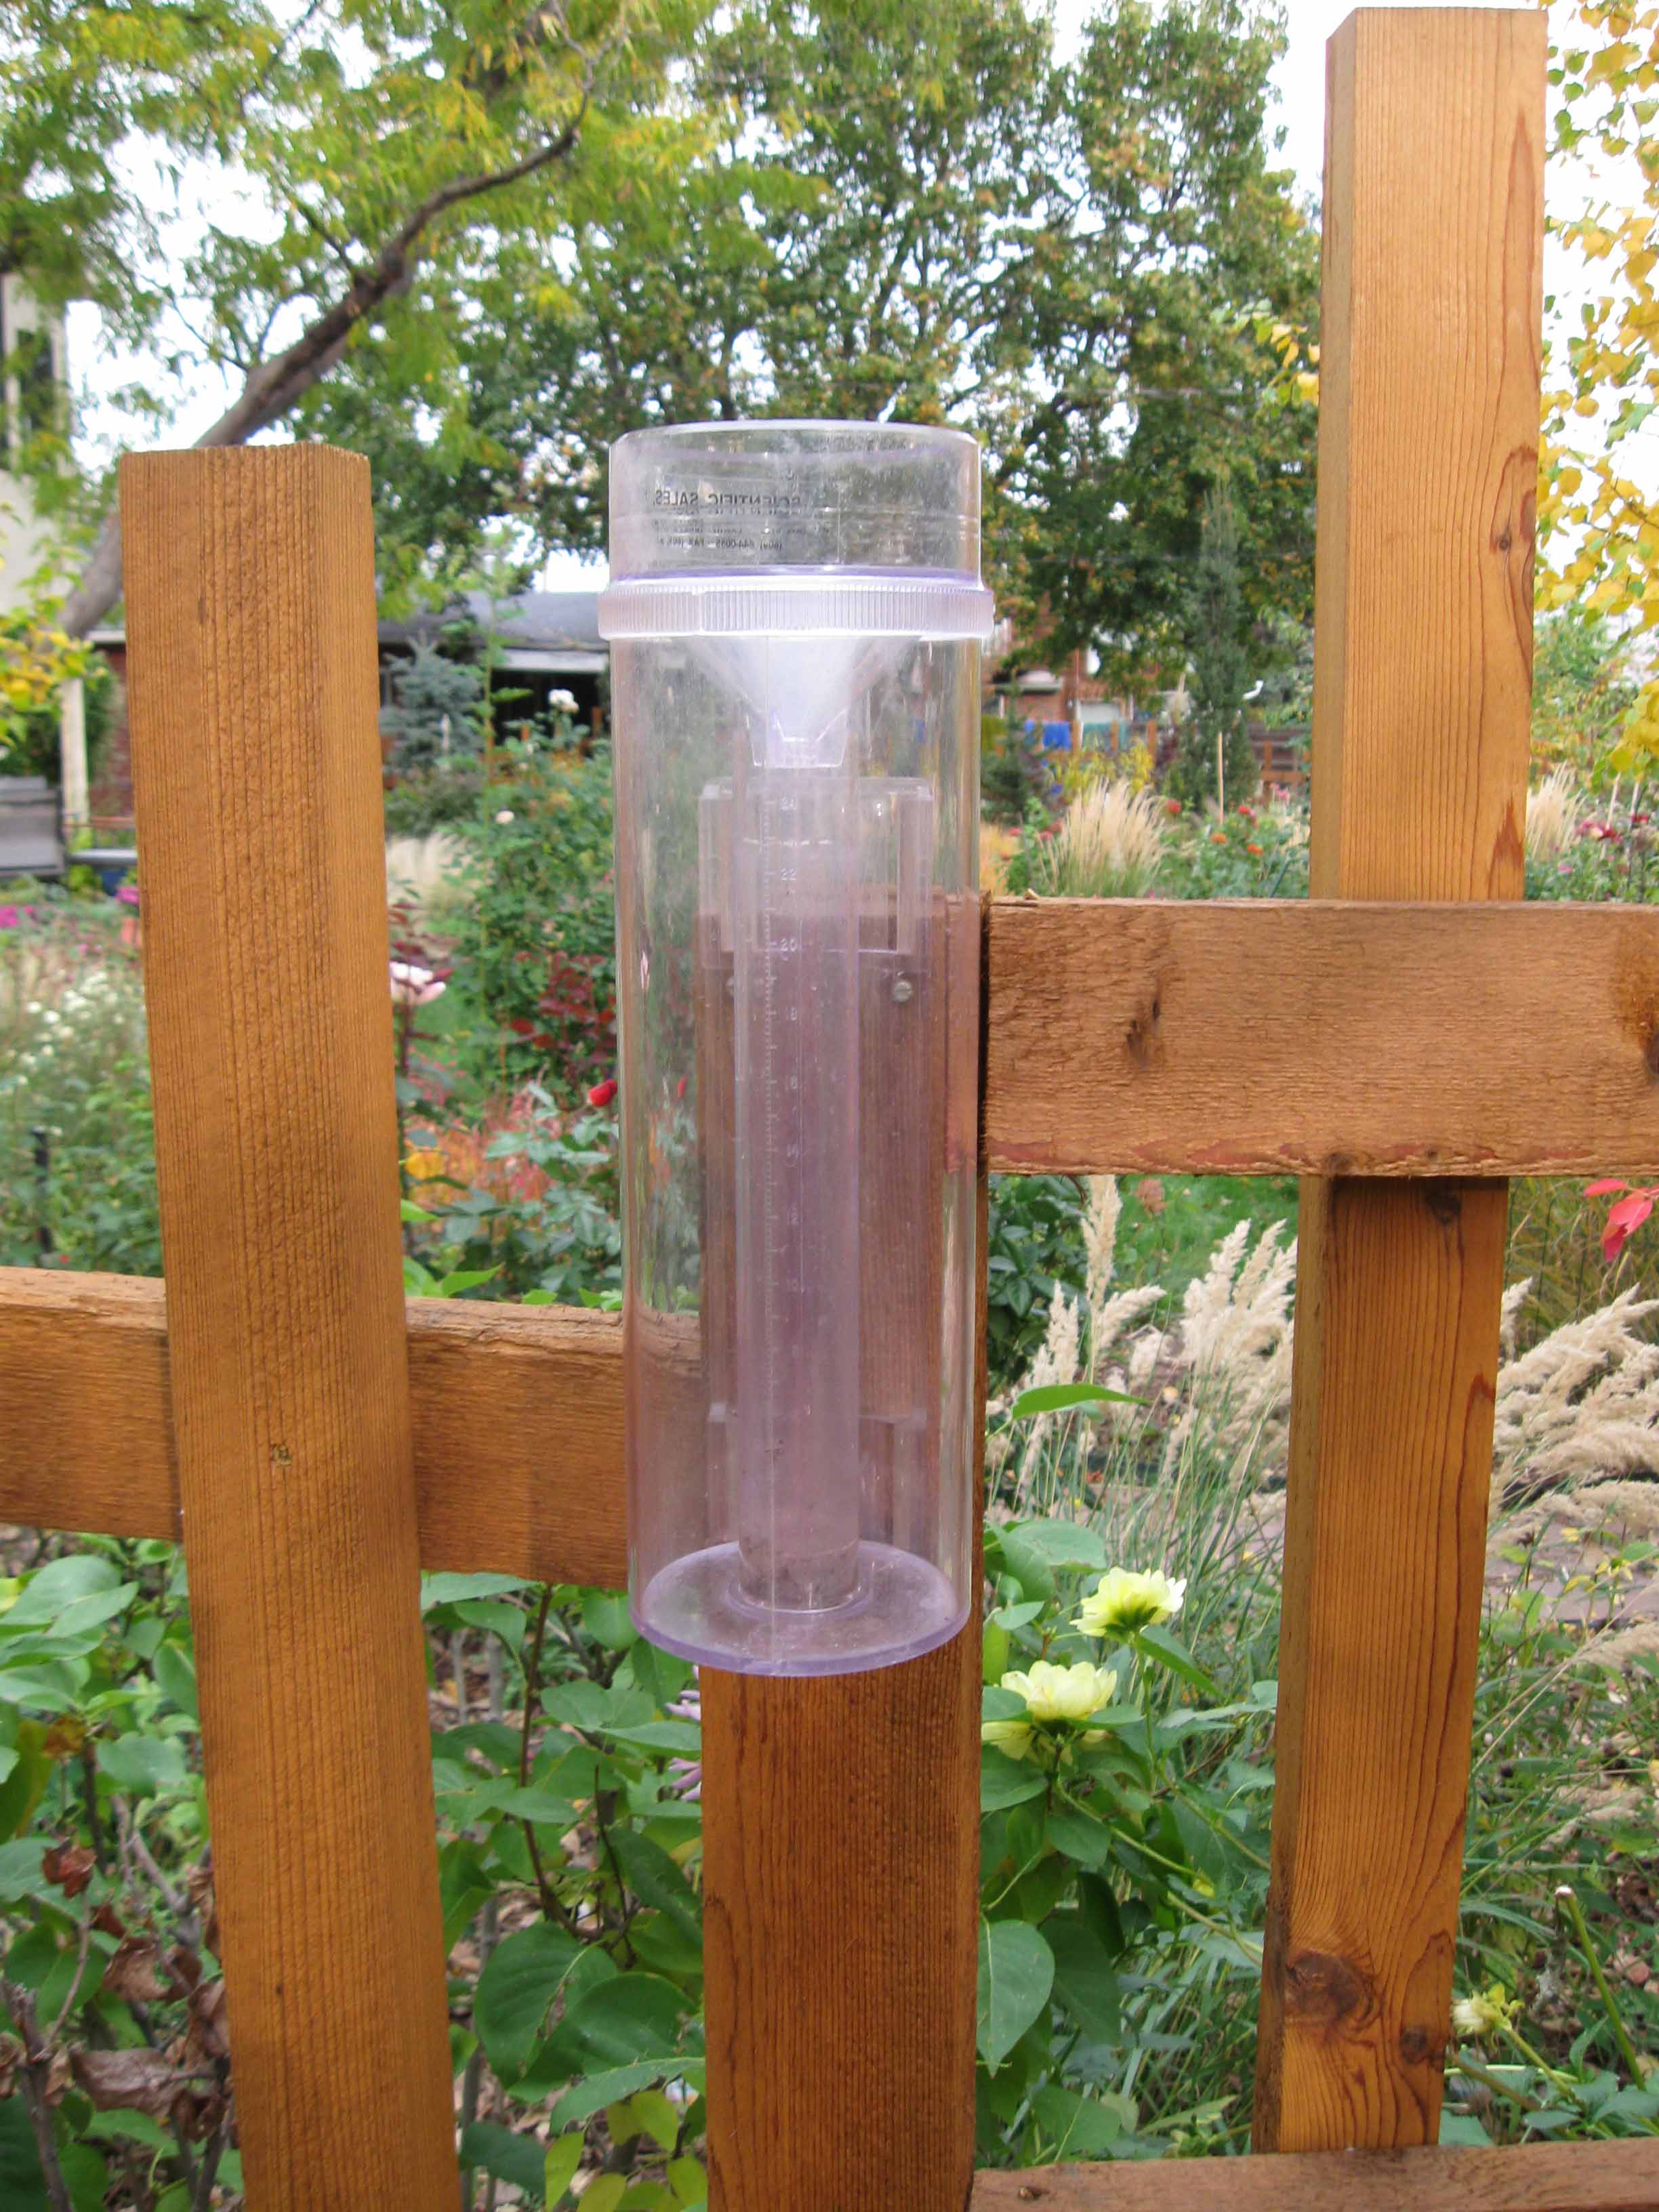
Figure 2. Plastic raingauge matching GLOBE specs. This gauge is about 12 cm in diameter. Note the tall tree in the background.
Neither gauge is in an ideal location. In both cases, there are nearby trees (Fig. 2, map) which might impact the measuring of the rain. This is a problem a lot of schools have: there is just no ideal place to put a rain gauge. We were particularly worried about the plastic gauge, which was closer to trees than the metal gauge.
Why do we have two gauges? The metal gauge was hard to use: its funnel didn’t fit easily into the gauge, so we had to pour the rain from the large gauge into the small tube after every rainfall event. We got the plastic gauge to replace the metal one. We put the gauge on the fence because it was well-secured. But the first six months we used the new gauge, the rainfall seemed too low compared to totals in other parts of Boulder. So, I put the metal gauge back outside and started comparing rainfall data.
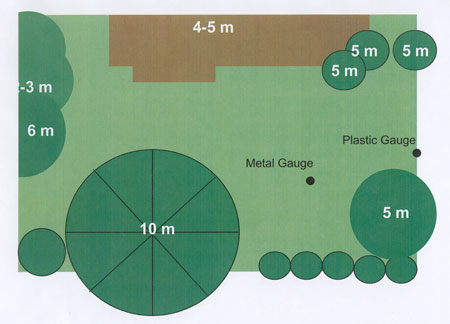
Figure 3. Map of our backyard. Left to right (west to east), the yard is about 22 meters across. The brown rectangular shape is our house; the circles represent trees and bushes. The numbers denote the height of the trees and bushes. The 10-m tree is an evergreen; the remaining trees and bushes are deciduous. The southeast corner of the house is about 3 m high.
How did the gauges compare?
Starting this summer, I started taking data from both gauges. Unfortunately, it didn’t rain much. And sometimes, we were away from home: so this is not a complete record. But I don’t need a complete record to compare the rain gauges.
Table: Rain measurements from the two rain gauges
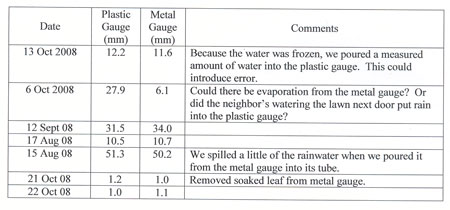
The results (in the table, also plotted in Figure 4) look pretty good. With the exception of the one “wild” point on 6 October 2008, the measurements are close to one another. We think that the plastic gauge was filled when the garden or lawn next door was watered. This would not be surprising: we have found rain in the plastic gauge when there was no rain at all.
I learned after writing this blog that Nolan Doeskin of CoCoRaHS (www.cocorahs.org) has compared these two types of gauges for 12 years, finding that the plastic gauge measures slightly more rain (1 cm out of 38 cm per year, or about 2.6%).
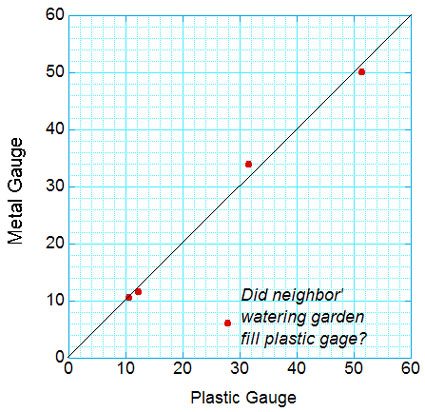
Figure 4. Comparison of rainfall from the two rain gauges in our back yard. Points fall on the diagonal line for perfect agreement.
I learned two things from this exercise.
First, I probably should have used the two gauges before I stopped using the metal one. That way, my rainfall record wouldn’t be interrupted if the new gauge was totally wrong. (I was worried that the trees were keeping some rain from falling into the gauge. This would have led to the plastic gauge having less rainfall than the metal gauge. And, since the blockage by the trees would depend on wind direction and time of year, I wouldn’t have been able to simply add a correction to the readings.) Fortunately, the new and old gauges agreed.
In the same way, if you want to replace an old thermometer with a new one, it’s good to take measurements with both for awhile, preferably in the same shelter. Suppose the new thermometer gives higher temperatures than the old one. If you want to know the temperature trend, you can correct the temperatures for one of the two so that the readings are consistent.
The second thing I learned is that it is o.k. to reject data if there is a good reason (such as people watering their lawns). It’s also important to note things going wrong – like my spilling a little bit of water on 15 August. If you keep track of things going slightly wrong (or neighbors watering the lawn), you can often figure out why numbers don’t fit the pattern.
I will continue to compare records for awhile, to see whether the readings are close to one another on windy days. If they continue to be similar, I will be able to try a method to keep birds away from the rain gauge that was developed by a GLOBE teacher – Sister Shirley Boucher in Alabama. Keep posted!