
This is the first blog about Dr. Kevin Czakjowski’s 2008 Surface Temperature Field Campaign. They will be interleaved with the Chief Scientist blogs, of which the current one is on watching birds.
Hi All,
I am very excited to be kicking off another GLOBE surface temperature field campaign. The field campaign will go from December 1, 2008 to December 19, 2008. Students are encouraged to take surface temperature observations of their local schoolyards.
Here are schools that have entered data so far in the field campaign:
The Morton Arboretum Youth Education Dept., Lisle, IL, US
Peebles High School, Peebles, OH, US
Kilingi-Nomme Gymnasium, Parnumaa, Estonia
Bellefontaine High School, Bellefontaine, OH, US
Oak Glen High School, New Cumberland, WV, US
Birchwood School, Cleveland, OH, US
The University of Toledo, Toledo, OH, US
Main Street School, Norwalk, OH, US
If you have entered data today and do not see your school’s name, do not worry. The database is updated each night. I expect that there will be many more schools involved this year.
Problems with Data Entry
I’ve looked over the data that has been submitted to GLOBE thus far. It looks like everyone is using Celsius. That is great. And, everyone is entering their snow depth in mm. Thanks. But…. A number of observations appear to have the incorrect Universal Time. It looks like a few of you saw your mistake and corrected it entering the new time of observation. This is critical. Entering the correct time is crucial to a good field campaign and having usable data. Don’t feel bad if you entered the wrong time though. I am having my graduate students in my remote sensing class observe surface temperature and enter data on the GLOBE website during the field campaign. I can tell that they entered the incorrect Universal Time the first time they entered their data. I’ll talk to them in class tomorrow about it.
This year’s theme is the International Polar Year associated with GLOBE’s Seasons and Biomes Project. We are hoping that as students gain an appreciation for the importance of the polar regions on the climate and that the students take the opportunity to learn more about the polar regions.
Alaska
It is really cold in Alaska today. Take a look at the temperatures in the figure below. The temperatures are in degrees Fahrenheit because that is the way surface weather data is displayed in the United States. Below you’ll see that the temperature in Fairbanks at 1623 UTC was –31º F (-35º C). That is really cold. The temperature in Fairbanks is colder than any temperature I have ever personally experienced. That cold air came over from Siberia in Russia. You’ll notice that at very cold temperatures, the Fahrenheit value and Celsius value are almost the same. What temperature are the Fahrenheit and Celsius temperature the same? I know that a couple schools in Alaska will be participating in the field campaign. It will be really interesting to see the temperatures the students report.
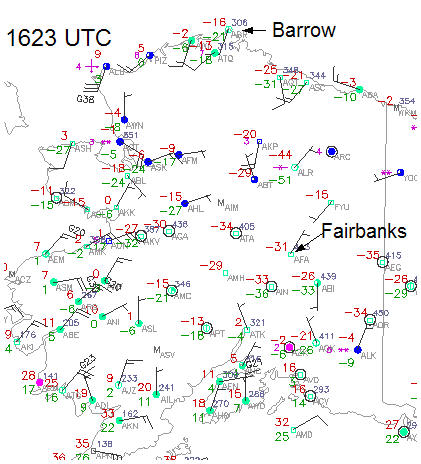
Figure 1. Weather observations in Alaska and surroundings.
The Forecast
The forecast for the next week is for cold air to move out of Alaska and northern Canada down into the continental United States. The cold air in Alaska is due to a high pressure system. When the cold air starts to move out of Alaska, it will take on the characteristics of the new surface it is moving over. If there is snow on the ground over which the cold air is moving, the air mass will not change. Basically, the cold air stays cold. Snow on the ground helps to insulate the air from the ground. If there isn’t any snow on the ground, the ground will warm the air above it and it won’t be as cold. Looking at the snow cover map for North America below, you can see that most of Canada is covered with snow and there is quite a bit of snow in the Great Lakes region. Having this much snow in the Great Lakes region this early in December is somewhat unusual. There usually is not this much snow this early. Once the cold air comes out of Alaska, if the air travels over snow covered regions, the air will not change much and those areas will be very cold. This is something to look forward to if you like winter like I do. I can’t wait until it is cold enough to set up the ice rink in the back yard.
Many of you will be able to report snow on the ground when you take your surface temperature observations. Here are two questions that you can think about while take the measurements.
1) How does snow cover affect the temperature during the day?
2) How does snow cover affect the temperature at night?
Figure 2. Current snow over North America.
I hope to see more and more data come into the GLOBE website!
Dr. C
I was looking at some of your blog posts on this website and I think this site is really informative ! Continue posting .