
I have written before on the so-called “scientific method” (or rather “methods“). So have so many others. So I was kind of surprised when I heard someone who should have known better to define science simply as “inference based on data” (or, equivalently, drawing conclusions from data).
Then again, this might not be too surprising.
Think of a typical science project, which starts with a hypothesis and some background, then goes on to describe methods, and then discussion and conclusions. That sounds to me a lot like “inference based on data.” Does it to you?
Do you know what is missing?
There is a very important next step: the testing of those conclusions by other scientists.
In practice, the first step is a “friendly review” of a scientific paper by a colleague. Many organizations require that scientific papers go through an “internal review” before the scientist submits it to a scientific journal. “Internal” means the reviewer or reviewers work for the same organization. The author of the paper needs to respond to the comments of the internal reviewers before sending the paper off to the journal.
The second step is anonymous peer review. The Editor of the journal sends the paper to two or three scientists who are experts on the subject of the paper. These “peer reviewers” are asked to go through the paper carefully, and comment on whether the conclusions of the paper are supported, and whether the paper prevents new results. The author has to correct any problems, and the reviewers get to comment on the corrections. Based on the reviewers’ comments, the editor will “accept” the paper so that it is published, “reject” the paper, or ask the scientist for further revisions.
Often, even before the paper is written, the scientist will present results at a scientific meeting. This is a good test of whether the work is robust or not. Often, questions at scientific meetings are quite helpful, and the scientist’s project is improved as a result. Discussions in the hall or during meals can be as useful as those at the formal sessions.
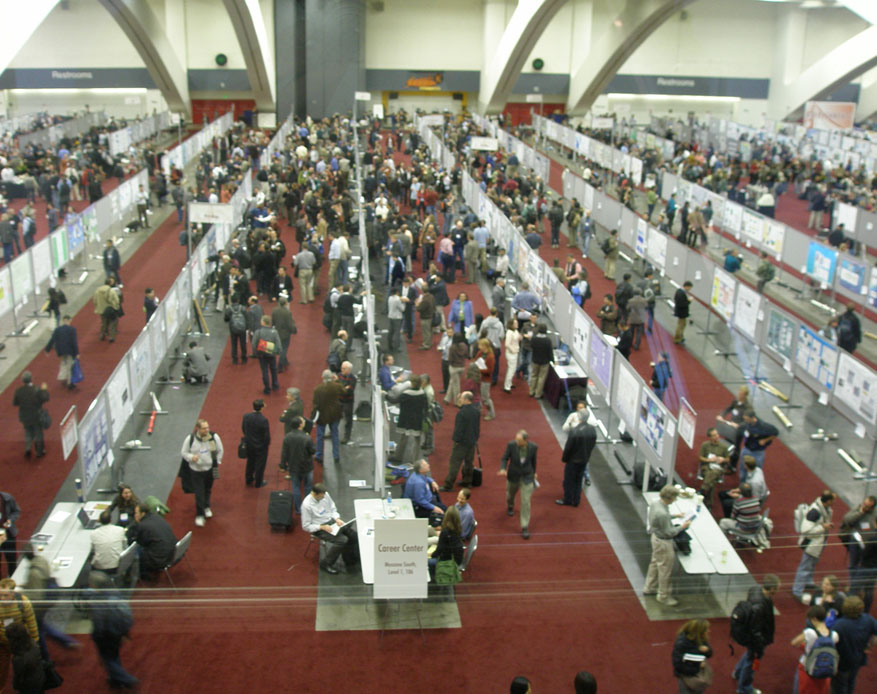
Figure 1. December, 2008 meeting at the American Geophysical Union. Photo by Kevin Czajkowski. Some scientists are presenting posters describing their results. Other people are just talking. In either case, the scientists are learning from one another.
Once other scientists become aware of the work, they can begin to evaluate the results through their own work. The other scientists find out either through seeing the first scientist speak at a meeting, from reading about the work in the journal article, or from word of mouth. This results in new papers, which may refine the first scientist’s conclusions, or perhaps show that the first scientist’s conclusions are wrong. These papers, too, go through the review process.
So – science is “self-correcting.”
Even so, science is full of “blind alleys” along which sets of observations seemed to make sense, and even predict the results of future experiments. But then, something isn’t quite right – and scientists realize an alternate explanation for all those observations and experiments.
Some famous examples of “errors” from history are:
- The planets having orbits that are perfect circles
- Space being filled with something called “ether”
- “phlogiston,” an element that was released when material was burned.
In these cases, the “correction” process took awhile, and you learn about it in your chemistry or physics classes. If you are not familiar with these concepts, you might want to do some research on the Web.
Here, I provide two examples of “self-correction” that happened quite rapidly. Both examples have to do with data from a large field campaign called GATE that occurred in 1974. During this field program, which involved 72 countries, scientists spent four months in Dakar, Senegal or in ships moored in the tropical Atlantic, taking measurements of the atmosphere and ocean with ships, aircraft, buoys, and a satellite (the first time satellite information was used in a large field program).
The first example involves measurements from aircraft of updrafts and downdrafts in thunderstorm clouds over the tropical ocean (or more accurately, cumulonimbus clouds, since there wasn’t much lightning). The aircraft would penetrate a single cloud, or cumulonimbus clouds arranged in a rainband or squall line. The scientists expected strong updrafts and downdrafts, but the updrafts and downdrafts sampled during GATE were surprisingly weak. The size and speed of these updrafts and downdrafts were reported in the literature, and followed by several papers on updraft and downdraft motions in cumulonimbus clouds in other locations over the tropical oceans.
A scientist wrote such a paper using aircraft measurements and submitted it to a scientific journal. The paper confirmed previous results. The paper went to the reviewers. At least one reviewer thought the paper was o.k. – After all, it was confirming previous results, basically strengthening the growing consensus that updrafts in cumulonimbus over the ocean were surprisingly weak – at least at altitudes below 5 kilometers, where the aircraft flew. But one reviewer somehow figured out that the author had been analyzing not the vertical speed of the air but the vertical speed of the aircraft! The authors had to withdraw the paper and do the data analysis over again.
The second example had to do with buoyancy of updrafts under fair-weather cumulus clouds, based on GATE aircraft data. GATE aircraft provided – for the first time, – abundant and usable measurements of temperatures and humidity just below cloud base, over the tropical Atlantic Ocean. One scientist was excited to find that the air feeding the clouds was buoyant, giving the clouds an extra kick. While updrafts beneath all clouds was warmer (buoyant) than the environment, the updrafts beneath the larger clouds was warmer and more buoyant than the updrafts beneath the small clouds. This made sense – the big clouds were growing more, so buoyant updrafts might be part of the reason the clouds were bigger, right?
Well, it turned out the reason that the updrafts were warmer was related to an instrument problem. Because the aircraft were flying over the ocean at altitudes as low as 30 meters above the surface, all the instruments, including the temperature sensors – were coated with salt from the ocean. (There are always some sea-salt particles in the air above the ocean.) When the relative humidity became high (which it does just below cloud base), the salt would absorb the water, which would liquefy, and this would release heat (condensing water releases latent heat). This warmed the temperature sensor, leading to artificially high temperatures. This effect was bigger for the bigger clouds because the sensors were exposed to humid updrafts for a longer time, so the air was warmer beneath the bigger clouds. Once the aircraft left the updraft, the air was drier, and the water on the sensor could evaporate again (and cool the sensor, making the air surrounding the cloud-base updrafts look cooler).
These results were presented at a scientific meeting – and the scientists at the meeting were quite excited. But the paper never got published, because of the discovery that the results had nothing to do with nature and everything to do with measurement error.
I was the scientist in the second example.
The inference based on the data looked correct to all of us, and thought to be reasonable by all of us. That is, until other scientists discovered the instrument problem, which happened after the meeting.
Looking back on this, this problem should have been obvious. There were measurements from three aircraft. On one aircraft, the technicians rinsed off the temperature sensor after every flight. On the second aircraft, the pilots deliberately flew through rain showers after each flight to rinse off the sensor – which didn’t happen if a rain shower wasn’t handy. And the temperature instrument on the third aircraft was rinsed only when the aircraft was required to go through rain (as would be the case when the aircraft were penetrating squall lines, for example).
And, you guessed it. The warming below clouds was greatest for the aircraft for which they did nothing, and the least for the aircraft with temperatures sensors rinsed daily!
So – when you do your science projects, and things seem to be working out right – remember that you might be missing something! But that is part of the fun of it.