
17 December 2007
The storm that moved through the center of the United States lived up to its billing. There was heavy snow, strong winds, heavy rain, tornadoes, freezing rain and sleet. In Toledo, Ohio we had about 5 cm of snow and then freezing rain and sleet on top of that. One of my friends could not get into his car because the ice froze over the car. I broke two ice scrapers trying to get the ice off of my car. After the ice, I think we had about 20 cm (8 inches) of snow at my house but then the wind blew the snow into drifts so it was hard to tell how deep the snow is. I was driving home from the store last night when I saw a car slide off the road into the deep snow in the ditch. I carry a shovel with me in my car in the winter so I was able to help him. A couple of young men, maybe seniors in high school, stopped and helped me push the car out. It felt good to help someone.
Figure 1 shows the snow and ice cover extent in the Northern Hemisphere. Compare that to the mean December snow water equivalent in Figure 2. The snow water equivalent is the depth of water that the snow will melt down to. For the storm over the weekend, the ratio of snow to water was probably on the order of 10:1 or 8:1. That means that for every 10 cm of snow it will melt to 1 cm of water. So, for the 20 cm of snow that we received in Toledo, Ohio there should be about 2 cm of water when the snow melts. Although the snow water equivalent and the snow extent are two different observations, the area of snow water equivalent can be used as an indication of snow extent. When you compare Figure 1 with Figure 2, how does the extent of snow cover today compare to the snow extent as indicated by the mean December snow water equivalent map in Figure 2?
Current Northern Hemisphere Snow Extent
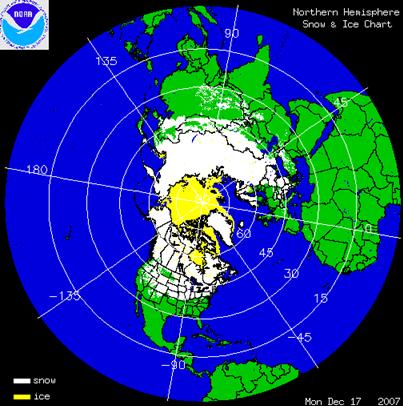
Figure 1. Current (17 Dec. 2007) snow extent in the Northern Hemisphere.
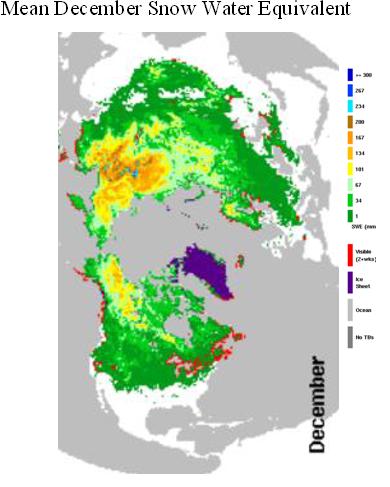
Figure 2. Mean snow water equivalent (SWE) for December. Source: National Snow and Ice Data Center.
How are the maps of snow extent created? One of the sources of data is from satellite imagery. Figure 3 is a satellite image from a geostationary satellite called GOES. Snow covers most of the image including the states of Iowa, Illinois, Wisconsin, Missouri and Indiana. How can you tell where the snow is in this image? Do you see clouds in this image as well?
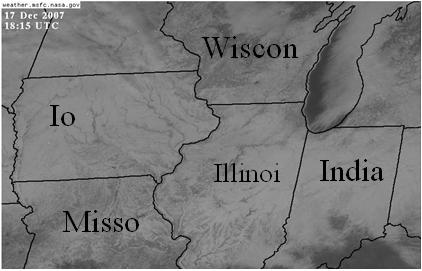
Figure 3. GOES (Geostationary) satellite image from 17 December 2007, 18:15 Universal Time.
As of this morning, we are up to 556 observations from 32 schools. I was able to add the observations from the University of Toledo.
| Roswell Kent Middle School, Akron, Ohio, USA Rockhill Elementary School, Alliance, Ohio, USA Dalton High School, Dalton, Ohio, USA Chartiers-Houston Jr./Sr. High School, Houston, Pennsylvania, USA Cloverleaf High School, Lodi, Ohio, USA The Morton Arboretum Youth Education Dept., Lisle, Illinois, USA Mill Creek Middle School, Comstock Park, Michigan, USA Kilingi-Nomme Gymnasium, Parnumaa, Estonia Polaris Career Center, Middleburg Heights, Ohio, USA National Presbyterian School, Washington, DC, USA White Cloud Public, White Cloud, Michigan, USA Blue Valley High School, Stilwell, Kansas, USA Perkins Middle School, Akron, Ohio, USA Steeple Run School, Naperville, Illinois, USA Kittrell Elementary School, Waterloo, Iowa, USA Lorain Community College Early College High School, Elyria, Ohio, USA Ingomar Middle School, Pittsburgh, Pennsylvania, USA Moosewood Farm Home School, Fairbanks, Alaska, USA Roxboro Middle School, Cleveland Heights, Ohio, USA Bowling Green State University, Bowling Green, Ohio, USA Ida Elementary School, Ida, Michigan, USA Whitehall High School, Whitehall, Michigan, USA Taaksi Basic School, EE2914, Viljandimaa, Estonia Birchwood School, Cleveland, Ohio, USA Gimnazium in Toszek, Toszek, Poland Waynesboro Senior High School, Waynesboro, Pennsylvania, USA Eastwood Middle School, Pemberville, Ohio, USA Orange Elementary School, Waterloo, Iowa, USA Estes Park High School, Estes Park, Colorado, USA Hudsonville High School, Hudsonville, Michigan, USA University of Toledo, Toledo, Ohio, USA Main Street School, Norwalk, Ohio, USA |
Take care,
Dr. C
Peggy,
I just wanted to say “thanks” for the information and all your wonderful efforts!
Regards,
Alfi W.
Thanks! And will forward your comments to Kevin Czajkowski, who worked so hard on organizing the surface temperature field campaign and keeping us all up to date on the weather and the results.
Best regards,
Peggy