
This is the second blog related to events at the GLOBE Learning Expedition that took place in Cape Town, South Africa, from 22-27 June 2008. (You can find daily reports, a photo gallery, and student delegation blogs at the above link.)
Have you ever arrived at a school event, movie, or concert, shivering in a cold auditorium at first, but then feeling too warm by the time the auditorium was full? (For an earlier discussion, see the blog, Human Metabolism: What is That?, posted 23 February 2007).
The opening day of the GLOBE Learning Expedition offered a perfect opportunity to show the effect of people on the temperature of a large room, Jameson Hall at the University of Cape Town (Figure 1).

Figure 1. Jameson Hall; photo by Jan Heiderer. The GLE banners in front are slightly less than 9 meters high.
In order to measure the temperature, Jamie Larsen of GLOBE installed the temperature sensor on the speaker’s podium on the stage. This kept the sensor away from the doors to the outside, and put the sensor in full view of the audience. The sensor was supplied to us by Robyn Johnson of Vernier Software and Technology, one of the GLE sponsors. The sensor was installed while the auditorium was still empty, so that we would know the temperature of the room before many people came in. It was attached to a data logger, which was attached to a computer, so that the audience could see what happened to the temperature of the hall from the time it was empty, to when the approximately 500 people attending came in and sat down, and through several welcoming talks.
Thanks to Jamie and Robyn, my welcome talk could include a science question, “How much had the room warmed up during the time people came in?” Most of the people in the audience thought that the room was warmer. And the graph did in fact show that the temperature had warmed – about 3 degrees Celsius. Unfortunately, the data logger was turned off without storing the data (there were more talks and a performance before Jamie could get back to the logger), but the warming curve looked very much like the one in Figure 2, which is basically a sketch of the curve rather than actual data.
Based on our memories, the photograph in Figure 1, and some pictures of Jameson Hall on the Web, we estimated the size of the Jameson Hall Auditorium to be about 30 meters high on average, and about 40 m by 40 meters inside. So that there were about 48,000 cubic meters of air in the auditorium. The room started out empty, but by the time it was full, there were 500 people.
Each person was giving off about 100 Watts* (one Joule of energy each second). A Joule is a measure of energy. To get a feel for the rate of energy release, think of a 100-Watt light bulb.
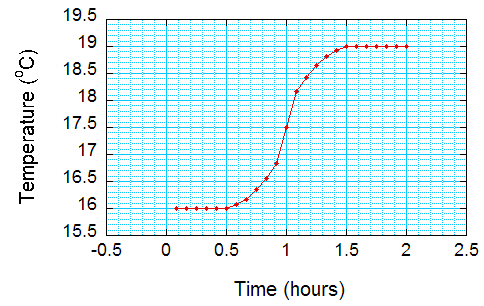
Figure 2. Sketch of the observed warming of Jameson Hall before and during the GLOBE Learning Expedition Opening Ceremony at Jameson Hall, University of Cape Town.
The curve showed steady and rather cool temperatures before people came in, a rapid warming phase as the hall filled, and then the temperature was steady again as the air adjusted to the number of people in the hall. It was surprising that the temperature didn’t continue to warm – the people were still releasing heat, but they kept the doors open to keep the hall from getting too warm. This suggests a new “equilibrium” with the heat escaping to the outside the same as the heat given off by those of us in the hall. (There did not seem to be any heating or air conditioning operating at the time.) The actual curve was so “perfect” many found it hard to believe it was real data!
So does the temperature increase make sense?
From the earlier blog, the heating per unit time by the 500 people is given by:
500 people times 100 Watts per person = 50,000 Watts.
50,000 Watts is equal to the change in heat content in the air per unit time (here seconds), written
Heat content change per second =
specific heat
times volume
times density of air
times temperature change per second
The specific heat is around 1000 Joules per kilogram per degree Celsius. (Specific heat is a nearly-constant number that relates heating of a given mass to its change in temperature.)
Let’s use this relationship to figure out what the temperature change should be over the roughly one hour or 3600 seconds the temperature climbed.
Temperature change = total heat input, divided by (volume x air density x specific heat)
Total heat input is 50,000 Watt times about 3600 seconds, or 180,000,000 Joules
Specific heat times volume times air density = 1000 K per Joule per degree C times 48,000 cubic meters x 1 kg air per cubic meter = 48,000,000 Joules per degree C
Temperate change in degree C = 180,000,000 Joules divided by 48,000,000 Joules per degree C, or about 3.8 degrees Celsius!
This is amazingly close to the measured temperature change.
You could try this experiment in your school. All you need is a thermometer (or perhaps more than one) to take temperatures before and during an event. The results might not always look like Figure 2, since heating and air conditioning systems are designed to keep the temperature the same. What does it mean if the temperature stays the same? If you had thermometers in different parts of the auditorium, would they show the same temperature changes? (Note: since the temperature change is important rather than the actual temperature, it is o.k. if the thermometers aren’t starting out at the same temperature).
*A nice discussion of the amount of heat release by an individual can be found in Energy, Environment, and Climate, by Richard Wolfson. (published 2008, by W.W. Norton and Company)
Excellent article. Keep posting such kind of info on your
page. Im really impressed by your site.
Hey there, You have done an excellent job. I will suggest to my friends.
I am sure they will be benefited from this website.
Where can we find out more about the Globe Learning Expedition?
Thanks
Here you go! http://www.globe.gov/events/globe-learning-expeditions/overview/gle-2014-new-delhi-india