
I am writing today about the north part of Midwest United States, what is today the so-called Corn Belt. A few weeks ago, GLOBE students in Ushuaia, Argentina and Fairbanks and Healy, Alaska, USA, gave examples of changes in the weather and animal behavior where they lived. While you read this, think about changes where you live, and how they might affect the climate.
Have you ever taken the tassels off corn? My friend Susan says it’s not a pleasant job when it’s hot – because it is so humid in the cornfield. Now think back 100 years. Probably there was prairie grass or trees where there is now corn. It was probably less humid.
I first got interested in the effects of crops on climate change when I was working on a field project out of Norman, Oklahoma. Norman is the home of the U.S. National Severe Storms Laboratory and the Storm Prediction Center, both of which are operated by the National Oceanic and Atmospheric Administration. Severe storms researchers and storm chasers love the Oklahoma area, because thunderstorms with strong winds, tornadoes, and large hail are relatively common.
Each day, we would go to the Storm Prediction Center for a weather forecast. Some of the scientists in the field project were interested in how storms formed and what made them strong enough to produce hail, tornadoes, and strong winds. I was interested in something simpler – what warms and moistens the air in the atmosphere’s lowest kilometer.
One morning, a man at the Storm Prediction Center told me he noticed that the dew points – a way of measuring humidity – were getting higher over Iowa. He wanted to know why this was happening. I had to tell him I didn’t know.
A few years later, I was in Iowa to help decide where to put the automatic weather stations for GLOBE ONE. So, I asked some of the farmers whether they thought it was getting more humid in Iowa, and why it could be happening. I got some interesting answers.
There are more acres of corn and soybean plants. And the plants are being planted closer together. So there are more corn and soybean plants. Several decades ago, the distance between corn rows was determined by the width of a horse’s rear end. Corn rows were planted about 42 inches (106 cm) apart. Once farmers started using motor-driven farm equipment, they were free to plant the corn rows 30 inches apart (74 cm), and soybeans 15 inches (37 cm) apart. Also, more and more farmers “tile” their fields for better drainage.
Searching on the Web, I found a paper that helped answer my questions further (“Relating changes in agricultural practices to increasing dew points in extreme Chicago heat waves”, by D. Changnon, M. Sandstrom, and C. Schaffer, in the journal Climate Research., 2003, volume 24, pages 243-254).
The authors show that the number of acres of soybeans is six times as large as it was in 1935, and the number of acres of corn had increased by about 25-33 per cent. More significantly, the total number of plants went up a lot, starting around 1960. More corn and soybean plants mean more water vapor in the atmosphere (assuming enough water in the soil).
The authors stopped short of saying that the increased amount of corn and soybeans grown led to more water vapor in the air over Iowa and the surrounding area, because they found that the rainfall for the 20 days prior to the heat waves had also increased. (This increase in rain could be related to more water vapor from crops, but it could also be related to different weather patterns. Sorting out causes is one of the hardest things in research on regional climates!).
The authors were interested in the dew points during Chicago heat waves. Some of their results are summarized in Figure 5.
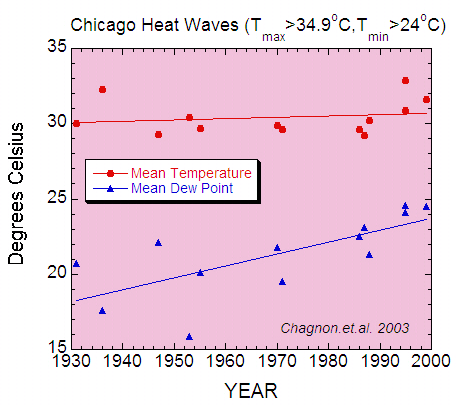
Figure 5. Average temperature and dew point during Chicago heat waves. To qualify, the maximum temperature needs to be greater than 34.9 C, and the minimum temperature has to be greater than 24 C for three days in a row. Based on data in Changnon et al. (2003).
From the graph, the average temperature did not change much during the heat waves. This is not too surprising, since the temperature was used to define the heat waves. You can see, though, that there seems to be more red dots on the right (in more recent years), so heat waves have been happening more often.
But what really interested me was that the dew points during the heat waves are getting higher. This makes things worse in two ways. First, it’s more uncomfortable when the humidity is high. And secondly, a higher dew point means a higher minimum temperature. (Remember, the dew point is defined as the temperature at which dew forms – once this happens, the condensation of the dew gives off heat, which slows down or even stops cooling.) This means that it is harder for people to cool off at night (unless you have air conditioning!)
In Iowa, the land that was once prairie is now mostly covered with corn and soybean plants. Can you think of ways that people have changed the ground cover where you live? Do you think it might have affected the climate?
Pingback: Climate Change - Overview - GLOBE.gov