
Recently, I posted the Hawaii record that showed that carbon dioxide has been increasing for the last several decades. To make the plot consistent with the global temperature plot, I showed only annual averages. Now, I show a copy of that same plot with seasonal information included.
Figure 1. Concentration of carbon dioxide at Mauna Loa, Hawaii (inset). NASA graph by Robert Simmon, based on data provided by the NOAA Climate Monitoring and Diagnostics Laboratory. Image from earthobservatory.nasa.gov/Newsroom/NewImages/…
This curve, which may be more familiar to many of you, has lots of wiggles. To look more closely at the wiggles, I obtained some data from the WLEF tower in Wisconsin, taken at 396 meters above the ground. The wiggles in Figure 2 show lots of variation from year to year, but there is a pattern. We can see the pattern easily if we average the data. During the winter, the carbon dioxide values are high. The values fall in the spring, and are smallest in July. By August, carbon dioxide values are increasing again.
What is happening? The WLEF tower is in a forest. During the spring and summer, the trees use up carbon dioxide in photosynthesis. As the trees leaf out, the carbon dioxide decreases. Once summer comes, photosynthesis starts slowing down, and so does carbon dioxide uptake. Like animals, both trees and the soils give off carbon dioxide in respiration. The curve shows the net effect of respiration and photosynthesis.
The carbon dioxide the tower measures does not just come from the forest – it can come from hundreds of kilometers away, and from grasses, shrubs, and crops as well as trees. Like the trees, these plants are also exchanging carbon dioxide with the atmosphere.
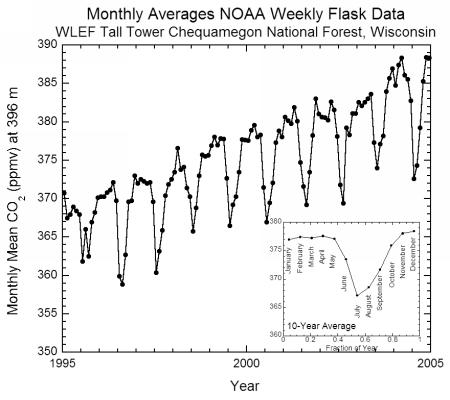
Figure 2. Monthly average flask values of CO2 from 396 meters above the surface. The inset shows the average for the ten years shown, to emphasize the change with seasons. Data collected by NOAA ESRL and The Pennsylvania State University and supplied by Ankur Desai (Dept of Atmospheric & Oceanic Sciences, University of Wisconsin-Madison).
Figure 2 is detailed enough to show lots of wiggles that don’t follow a smooth seasonal pattern. As the winds change, air with higher or lower values of carbon dioxide might be brought in. Where would carbon dioxide values be highest? Combustion produces carbon dioxide, so there will be higher values where there are lots of cars, factories, or fires. When trees are leafing out and growing, the carbon dioxide will be taken up. So it is possible that sharp peaks may be for times when the wind was bringing carbon dioxide from an area with lots of cities. Have you ever seen data on how much carbon dioxide is in the air near you?
I was reading your article, which was extremely interesting, and I want to ask you how the “immense amounts of carbon dioxide†are related to carbon dioxide concentration in marine water.
I have considered the Steuber & Veizer study of 2002, but I could not find seasonal information referred to the last ten years.
The formation of calcium cement High/Mg in marine water is represented in a detailed graph similar to yours (fig n°2), so it is possible to calculate the range of the carbon dioxide variations caused from nature, winds and anthropic carbon dioxide.
The CaCO3 precipitation or dissolution in water is linked to the addition or subtraction of CO2 depending on following balance reactions:
If there is a CO2 subtraction (evaporation, photosynthesis), the reaction moves towards left and CaCO3 precipitates. Of course, the biggest CaCO3 precipitation happens during spring-summer.
Moreover, it would be interesting to observe how curves without a standard flow are compared to Atlantic CaCO3 percentile variations.
In summary, it is easy to understand the huge influence of carbon dioxide on the earth\’s evolution, shore formation and coral reef life.
Dr. Diego Delli Carri
QBR Magazine
Thanks for writing.
I waited awhile to respond to you because I had to talk to some folks first about this –my knowledge about the ocean is very limited.
It is true that the world’s oceans play an important part in the carbon budget: in fact, I’m working on a blog now related to the recent news that the oceans are becoming less efficient as a carbon sink — at least for now. (This being related to waters near the surface around Antarctica having more carbon dioxide due to the strong winds mixing up carbon-dioxide rich deeper waters).
The chemical reactions within the waters are just one more complicating factor.
I know that the geologists are quite interested in what happens with the ocean — there are a number of studies trying to reconstruct the carbon budget over geologic time, related changes not only to what happens with plants but also with the new rock forming and subduction of old rocks. Some of these studies suggest carbon dioxide contents as high as 5-10 times the amount in the atmosphere today. And then there’s the additional threat of escape of methane from clathrates.
Valuable insights! Thanks for the piece of article. I have been borne in Kailua, Hawaii. Since 1983, I am in roofing business. From up there I can see a lot of changes in the environment of Hawaii, especially Oahu. Its a very beautiful place, no question on that but people, mostly tourists will get lessen in a couple of decades if the CO2 rate gets increased. We can start movements now accordingly & sustain it till we get a healthier environment.
Peter M.