
Did you know that you could count cricket chirps to estimate temperature? I heard this a number of years ago, but never thought much about it until I heard it mentioned on television this summer. Was this true, or just an urban myth? I decided to go outside and see for myself. Starting in August, I started listening to crickets. I estimated the “cricket temperature” from the first formula I found on the Web:
Cricket temperature in degrees Fahrenheit = number of chirps in 15 seconds + 37.
I measured the actual temperature by taking the average from two thermometers. One is mounted on the house at about eye level (1.5 m) beneath the overhang where we park our car. The second lies on the table on our deck, at about 1.5 m above the ground. A louvered sun-roof on the deck keeps the thermometer from cooling too much. In both places, there is enough wind for ventilation. But I had to ignore the house-mounted thermometer if our car was warm (i.e., recently driven). Though I did not have a GLOBE instrument shelter, the height matches that for the GLOBE air temperature protocol.
It took me a week or two to figure out how to count cricket chirps. 15 seconds was too short a time — I kept ending up with numbers like 30-and-a-half chirps. Or I would lose track or start too early or too late. So I tried 30 seconds. That way if I was between 60 and 61 chirps, the resulting error would be divided by two.
Then I discovered that the crickets didn’t always chirp together (CHIRP CHIRP CHIRP) but sometimes got out of synch (chir-rurp chir-rurp chir-rurp). In this case, I would count the chirps when they were in unison, and try to maintain the beat until they got back in unison again. To make things more accurate, I’d count chirps for five 30-second periods, average the number, and then divide the average by two. If there were two sets of crickets that weren’t always chirping at the same time (say an “alto” group and a “soprano” group), I’d count the alto chirps for one 30-second period and then count the soprano chirps for the next 30-second period.
I ended up with a lot of data for temperatures above 70 degrees. But getting numbers at the cooler temperatures was harder.
Since temperatures are the coolest around sunrise, I had to start getting up around 2:00-3:00 a.m. and 5:00 a.m. to get data for the cooler temperatures.
How well did the formula work? You can see from the first graph, in Figure 1. If everything (the formula, my counting, the thermometers) worked perfectly, all the red dots would fall on the black line. That is — along the black line the “cricket temperature” is equal to the measured air temperature.
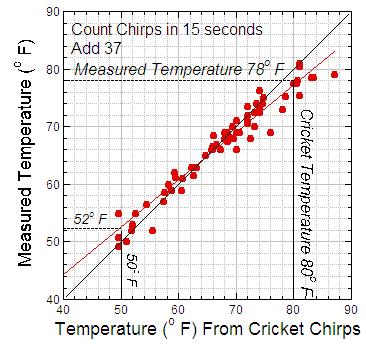
Figure 1. Air temperature measured from cricket chirps. For this graph, the number of chirps during 15 seconds is added to 37 to get the air temperature. The highlighted temperature readings are for the red “best-fit” line.
In the graph, the data are close to the black line, but not always on it. The red line is the straight line that best fits the data. Notice that the red line drops below the black line for high temperatures. Thus from the red line, for a “cricket temperature” of 80 degrees Fahrenheit, the measured air temperature is only 78 degrees Fahrenheit. Similarly, from the red line, a cricket temperature of 50 degrees Fahrenheit corresponds to a measured temperature of 52 degrees Fahrenheit — not exactly right.
So I plotted cricket chirps against air temperature to get a better method: Count cricket chirps for 13 seconds, and then add 40 degrees. Using this method, the points (and the red line) are much closer to the black line.
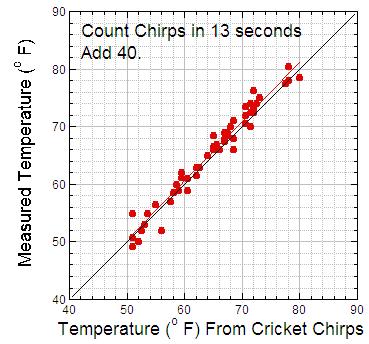
Figure 2. Air temperature measured using cricket chirps. For this graph, the number of chirps during 13 seconds is added to 40 to get the air temperature. As in Figure 1, the black line is where the points would fall if the method was perfect, and the red line is the line that best fits the data.
Clearly the approach in Figure 2 works slightly better. The red “best-fit” line through the data lies almost on top of the “perfect fit” black line. I later found this method was also on the Web.
If you find it hard to count chirps for 13 seconds, count chirps for a longer period (say 30 seconds) and then multiply by 13/30 to get the chirps in 13 seconds. Or if you are really patient, count chirps for a full minute and multiply by 13/60.
Notice that both the “cricket temperature” and the measured temperature stay above 50 degrees Fahrenheit. Both my husband (who helped collect data when I was gone) and I heard no cricket chirps at all when the measured temperature was 49 degrees Fahrenheit or lower. This suggests that 50 degrees Fahrenheit is at about the lower limit for when crickets chirp.
I had suspected that the lowest temperature for chirping crickets would be 50 degrees Fahrenheit or less. Why? Because meteorologists who study winds using radar have noticed that insects stop flying (and producing radar echoes) at 50 degrees Fahrenheit (or 10 degrees Celsius). I reasoned that it would take about the same energy — or less — to chirp than to fly, since chirps are produced by crickets rubbing their wings together, which should consume less energy than flying.
For comparison, a posted article from Dartmouth College lists 55 degrees as the minimum temperature for cricket chirps. Both my husband and I noticed fewer crickets (one or two) were chirping when the temperatures were in the lower 50s, so some crickets probably did stop chirping at that temperature, but not all.
Finally, let’s plot the data to show the relationship between cricket chirps and the temperature in Celsius degrees. Figure 3 shows this relationship. Again, the “best-fit” red line and the data are close to the “perfect fit” black line.
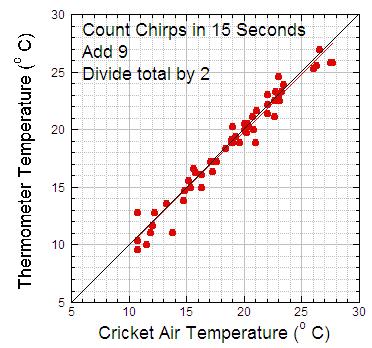
Figure 3. Relationship between cricket chirps and the temperature in degrees Celsius. As in Figures 1 and 2, the black line is where the points would fall if the method was perfect, and the red line is the line that best fits the data.
You can find several approaches on the Web, but it is not certain where they came from, and the raw data aren’t available, so you don’t know how many measurements were taken to determine the approach. Here I provide the data set so that you can play with it — or add your own observations. Have fun! It will be interesting to see whether chirps from crickets in the other parts of the U.S. and world relate to temperature in the same way.
Cricket Chirp Data – Boulder Colorado, USA. All dates 2007
| Date | Time (MDT) | Chirps/15s | Chirps/13s | Temp (F) | Temp(C) |
|---|---|---|---|---|---|
| 21 Aug | 2030 | 44.000 | 38.133 | 80.500 | 26.944 |
| 21 Aug | 2100 | 46.400 | 40.213 | 78.500 | 25.833 |
| 21 Aug | 2200 | 43.600 | 37.787 | 78.000 | 25.556 |
| 24 Aug | 1945 | 35.000 | 30.333 | 73.500 | 23.056 |
| 24 Aug | 2015 | 35.000 | 30.333 | 70.500 | 21.389 |
| 24 Aug | 2100 | 32.600 | 28.253 | 68.000 | 20.000 |
| 24 Aug | 2200 | 28.900 | 25.047 | 66.000 | 18.889 |
| 24 Aug | 2230 | 27.700 | 24.007 | 65.000 | 18.333 |
| 25 Aug | 0030 | 25.500 | 22.100 | 61.500 | 16.389 |
| 25 Aug | 0330 | 20.375 | 17.658 | 57.000 | 13.889 |
| 25 Aug | 0500 | 12.500 | 10.833 | 55.000 | 12.778 |
| 25 Aug | 2000 | 37.000 | 32.067 | 76.250 | 24.583 |
| 25 Aug | 2030 | 37.500 | 32.500 | 74.000 | 23.333 |
| 25 Aug | 2100 | 36.500 | 31.633 | 74.000 | 23.333 |
| 25 Aug | 2200 | 36.200 | 31.373 | 72.500 | 22.500 |
| 26 Aug | 0530 | 33.000 | 28.600 | 66.000 | 18.889 |
| 26 Aug | 2030 | 43.000 | 37.267 | 77.500 | 25.278 |
| 26 Aug | 2200 | 46.000 | 39.867 | 78.500 | 25.833 |
| 27 Aug | 2000 | 29.000 | 25.133 | 68.500 | 20.278 |
| 27 Aug | 2030 | 31.700 | 27.473 | 68.500 | 20.278 |
| 27 Aug | 2100 | 31.000 | 26.867 | 68.000 | 20.000 |
| 27 Aug | 2200 | 28.750 | 24.917 | 66.000 | 18.889 |
| 28 Aug | 0240 | 23.500 | 20.367 | 59.000 | 15.000 |
| 28 Aug | 2010 | 32.400 | 28.080 | 70.000 | 21.111 |
| 28 Aug | 2050 | 31.000 | 26.867 | 69.000 | 20.556 |
| 28 Aug | 2200 | 29.500 | 25.567 | 67.000 | 19.444 |
| 29 Aug | 0240 | 22.500 | 19.500 | 61.250 | 16.250 |
| 29 Aug | 0440 | 20.600 | 17.853 | 58.500 | 14.722 |
| 29 Aug | 2000 | 35.000 | 30.333 | 72.000 | 22.222 |
| 29 Aug | 2050 | 33.100 | 28.687 | 71.000 | 21.667 |
| 29 Aug | 2200 | 31.500 | 27.300 | 69.000 | 20.556 |
| 29 Aug | 2330 | 28.800 | 24.960 | 66.500 | 19.167 |
| 30 Aug | 0330 | 21.300 | 18.460 | 60.000 | 15.556 |
| 30 Aug | 2000 | 37.800 | 32.760 | 75.000 | 23.889 |
| 30 Aug | 2055 | 37.000 | 32.067 | 73.250 | 22.917 |
| 30 Aug | 2200 | 37.100 | 32.153 | 72.500 | 22.500 |
| 1 Sep | 2200 | 36.200 | 31.373 | 70.000 | 21.111 |
| 2 Sep | 0330 | 31.400 | 27.213 | 67.500 | 19.722 |
| 2 Sep | 0600 | 30.200 | 26.173 | 66.000 | 18.889 |
| 4 Sep | 0240 | 31.300 | 27.127 | 69.000 | 20.556 |
| 4 Sep | 0505 | 26.100 | 22.620 | 63.000 | 17.222 |
| 5 Sep | 0500 | 25.200 | 21.840 | 63.000 | 17.222 |
| 6 Sep | 0600 | 23.660 | 20.505 | 61.000 | 16.111 |
| 7 Sep | 0215 | 22.250 | 19.283 | 62.000 | 16.667 |
| 7 Sep | 0525 | 17.500 | 15.167 | 56.500 | 13.611 |
| 9 Sep | 2010 | 15.500 | 13.433 | 55.000 | 12.778 |
| 9 Sep | 2110 | 14.750 | 12.783 | 52.000 | 11.111 |
| 10 Sep | 2115 | 15.000 | 13.000 | 53.000 | 11.667 |
| 10 Sep | 2210 | 14.000 | 12.133 | 50.000 | 10.000 |
| 11 Sep | 0315 | 18.500 | 16.033 | 52.000 | 11.111 |
| 16 Sep | 2100 | 27.700 | 24.007 | 65.000 | 18.333 |
| 17 Sep | 2200 | 26.000 | 22.533 | 63.000 | 17.222 |
| 18 Sep | 0130 | 21.700 | 18.807 | 59.000 | 15.000 |
| 19 Sep | 0415 | 12.500 | 10.833 | 50.750 | 10.417 |
| 19 Sep | 0435 | 12.500 | 10.833 | 49.250 | 9.5833 |
Thank you for collecting so much good data. I am a high school math teacher and I am planning on using this data in class for a lesson on linear regression. Thanks!