Measuring rainfall – it’s easy and difficult at the same time

This week we welcome long-time friend of GLOBE, Dr. Peggy LeMone, Chief Scientist for the GLOBE Program from 2003-2009, as our guest blogger. Dr. LeMone is currently working in the field of weather and cloud formation at the National Center for Atmospheric Research (NCAR).

Originally posted at http://spark.ucar.edu/blog/measuring-rainfall on September 23, 2013.

Dr. Peggy LeMone
Dr. Peggy LeMone,
Credit: UCAR

Dr. Peggy LeMone is an NCAR Senior Scientist who studies weather and cloud formation. For more information about her research, visit Peggy’s home page.

A guest post by NCAR scientist Peggy LeMone

The Boulder, Colorado area received huge amounts of rain in mid-September.  You also learned that rainfall amounts vary a lot. Which brings us to the questions – How do you measure rain?  And how accurate are the measurements?  Even though I have done weather research for many years, during this storm I was reminded how hard it is to measure rain accurately.

This is the story of my attempts to measure rain during the storm. It’s also about the many possible sources of error when making rain measurements – from old rain gauges to growing trees and even, possibly, inquisitive raccoons.

By Monday morning (September 16), I had measured over 16 inches, or 405 millimeters (mm), in our backyard rain gauge from the storm which began September 10.  The gauge is the same type the National Weather Service uses. It has a funnel that deposits rain into an inner tube with a smaller diameter (like this one), but bigger. The inner tube’s diameter is just small enough to make the depth of rain ten times what it would be in a gauge without the tube and funnel.  Thus, each inch in the tube is equivalent to 0.1 inches (a tenth of an inch) of rainfall.  This is equivalent to how the GLOBE rain gauge measures rain: the inner tube acts like a 10x magnifying glass for the area of the rain gauge.  This makes it easier to read accurately!

My gauge is old. I inherited it from a weather-observing neighbor who moved away.  The funnel and inner tube doesn’t quite fit, so, I leave the gauge open and then pour the rain into the inner tube using the funnel.

rain gauge

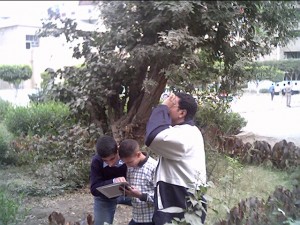
The rain gauge, Credit: Peggy LeMone

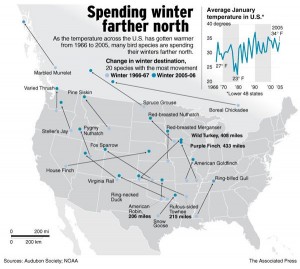
On the morning of September 12th, the gauge was so full and heavy, with over seven inches (178 mm) of rain that I decided to stick a meter stick in the gauge to measure the rain amount, and save pouring into the inner tube for the end of the storm.  The gauge tilts slightly, so I took a measurement on the uptilt side and the downtilt side and calculated an average.   That evening I found that the bottom of the gauge sagged in the middle, leading to an even deeper measurement than the downtilt side.  With these flaws, the lack of the ten-to-one exaggeration of depth, and some measurements being taken in the dark with a flashlight, my data were only approximate. I recorded measurements to within the nearest quarter inch (see the graph below).

Were my measurements accurate? On Friday morning, September 13, I took measurement using a more accurate method to compare with my estimates.  After bailing out five full tubes of rain, I poured the remaining water through the funnel into the tube to a depth of 13.5 inches (343 mm), spilling a little bit during this process.  The result was 0.38 inches (9.5 mm) more than my rough estimate from the night before – a storm total of 14.52 inches (369 mm) up to this time. On the graph, this is marked as 1. (The lower shows the uncorrected values.)

But the rain hadn’t stopped.  I awoke on the morning of September 15th and heard reports that up to 2 inches (51 mm) of rain fell overnight. I went outside to check our gauge – only to see that it had been knocked over (probably by raccoons).  Fortunately, I have a second rain gauge in my backyard – a plastic gauge that registered about 0.25 inches (6 mm). I added a conservative 0.2 inches (5 mm), since this gauge was under trees (marked as 2 on the graph).

The final number:  16.37 inches (416 mm) of rain, more or less.

graph showing total rainfall

Why do I add “more or less”?   Because there is uncertainty in the measurements. The metal gauge had been in the same place for several years, but I have moved it in the past year away from a growing tree.  I noticed on September 13 that the tree had intruded again: the end of one branch was about 10-15 feet (2-3 meters) over the gauge, or slightly to the east. Runoff from this branch could have added to the total before I moved the gauge four feet (~1 meter) to the west for the last two measurements.  It is also possible that the 0.98 inches (25 mm) could be high, but I doubt it: I had briefly run a sprinkler hose at a low setting, but I had moved the gauge out of the way and I turned the water off immediately once the rain started.  Switching the rain gauges adds uncertainty and so does the previously-mentioned spillage when I poured the remaining water in the gauge into the tube. Also, because my rain gauge was open at the top, some of the water could have evaporated, although evaporation was probably minimal, given the high relative humidity.

looking up from rain gauge

Looking up from where the rain gauge was before Time 2. The tree is to the north and east. Credit: Peggy LeMone

The exposure of the rain gauge is undoubtedly the greatest source of error.  According to the National Weather Service and CoCoRAHS (both of which use citizen volunteers to measure rainfall), “exposure” of the rain gauge is important. Rain may be blocked by nearby obstacles causing the number to be lower than it should. Or, rain may be blown into or away from the gauge by wind gusts.  The recommendation is that the gauge be about twice the distance from the height of the nearest obstacles, but still sheltered from the wind.

The gauge was certainly sheltered from the wind.  It is located about 10 feet (~2 meters) south of the house, which is about 15 feet (5 meters) high, and to the west of a fence and small trees as well as the tree in the photograph.   There is a much smaller tree to the southwest.

All the obstacles suggest that some rain could have been blocked from reaching the gauge, which would imply that the rainfall total is too small.  On the other hand, some rain might have been running down the branch in the picture. (In fact, because of the large amount, I thought this might be the main effect before doing some research on exposure)

It is also recommended that the gauge be level, which it wasn’t.  I’m not too worried about this, since it was nearly vertical.

The conclusion?  There was a lot of rain.  It could have been an inch (25 mm) more or less than my measurement. Acknowledging this is called reporting error. It doesn’t mean that the measurements are wrong, it just gives an idea of how accurate they are. My total was not the largest; there were at least two other measurements near 18 inches (457 mm).

Now that I’ve described all that can go wrong measuring rainfall, let me add that, putting a rain gauge in the right place, and taking an accurate rainfall measurement is fairly easy. If you have a perfect cylinder, such as a GLOBE rain gauge, simply stick a ruler in and read the depth (make sure to correct for any offset of the “zero” line and correct for this offset; and see if the ruler pushes the water level up very much).

If you don’t have a rain gauge but have a bucket (or glass) with sides that aren’t straight up and down, you’ll need to do a little math to figure it out. Here’s what you’ll need to do:

  1. Measure the diameter of the bucket at the level of the rain.  Subtract out twice the thickness of the walls.
  2. Measure the diameter of the bucket at the bottom in the same way.
  3. Calculate the average of the two diameters.
  4. Divide by two to find the average radius.
  5. Find the average volume of rain = Depth x radius x radius x 3.14.
  6. Find the area at the top of the bucket (this is the area over which the rain is collected).
    1. Measure the diameter
    2. Divide the diameter by 2 to get the radius
    3. Area = radius x radius x 3.14 (remember that Area = pi x radius2)
  7. Divide the rainfall volume by this area to get the rainfall.

It would be an interesting activity to put several buckets (or rain gauges) in different places in a field, your back yard, or your schoolyard to see how much the measurements vary within the area. Soup cans, though not perfect, would work pretty well for the activity, especially if they’re the same size.  I might try this during the next rainstorm.  (I hope not too soon!)

Does your school collect precipitation data? Have you had an extreme weather event that you were able to record? Let us know by adding a comment!

Posted in Atmosphere, Backyard Science, North America | 5 Comments

The transition seasons – why measurements now are very important

The seasons of spring and autumn are seasons of transition in the mid-latitudes – they hold onto memories of the season before while providing glimpses of the season to come.  Recently, the Northern Hemisphere transitioned into meteorological fall, including the months of September, October, and November.  As September begins, daytime high temperatures remember summer’s warmth, yet a few weeks to months later are dramatically different.  Mornings spent with a slight chill in the air soon require additional layers to prevent the cold.  These transitions can happen over a few short weeks or extend through the months.

It is the change to these transitions, such as the average date of first frost, that are an important key to understanding a changing climate.  Even small changes can have a large effect on migrating birds.  The date of first or last frost can prompt birds to begin their flight patterns either too early or too late, which puts their survival at risk.  The Ruby-throated Hummingbird (Archilochus colubris), for example, may be prompted to migrate later due to temperatures remaining warm late into autumn.  However, as they migrate, they may encounter colder weather due to a transitioning Arctic weather system.  If they left their summering location at their normal time, they would avoid these extreme weather events.  You can see the normal migration pattern of the Ruby-throated Hummingbird in the map below.

Image from Journey North, depicting the migratory route of the Ruby-throated Hummingbird.  Finish is their wintering location in Costa Rica

Image from Journey North, depicting the migratory route of the Ruby-throated Hummingbird. Finish is their wintering location in Costa Rica

This idea is further supported in the following map, which was produced by the Audubon Society and NOAA which shows that migrating birds are spending their winters farther north due to warming temperatures.  The light blue dots symbolize the general location each species wintered in 1966-1967. The dark blue dots connected by the line represent where the species wintered in 2005-2006.

Map showing changes in wintering location for various bird species from 1966-67 to 2005-06.  From Audubon Society and NOAA

Map showing changes in wintering location for various bird species from 1966-67 to 2005-06. From Audubon Society and NOAA

In some cases, these birds are more than 650 km from their 1966-1967 wintering location.  In addition to putting the birds in the path of transitioning weather patterns, dramatic shifts like these can upset the delicate balance of local ecosystems; insects and plants that these birds naturally prey on may quickly become over-populated if the migrating birds are wintering elsewhere. An example of this can be seen in the Elementary GLOBE book, “The Mystery of the Missing Hummingbirds.”

As we venture further into autumn in the Northern Hemisphere and spring in the Southern Hemisphere, it is important to keep an eye to our GLOBE instruments to monitor the changes that are affecting not only birds, but plants and other creatures that rely on weather changes for their survival.

You, as a GLOBE student, are given a unique opportunity to collect and submit data that can be used to study the transition seasons.  Students in the Kingdom of Bahrain are already examining this change in order to understand how the birds are adapting to their changing climate.   Be sure to start performing basic protocols, such as air temperature, precipitation and soil temperature, and add in other phenological protocols, such as Ruby-throated Hummingbird observations, arctic bird migration and green up or green down, to monitor these important transition season events.  And be sure to let us know about your research as it develops. These activities also help students understand the Next Generation Science Standards of Crosscutting Concepts, such as “Cause and Effect” and “Systems and System Models,” found in the progression of Earth Systems Science.

Posted in Earth as a System, Earth System Science, GLOBE Protocols, Seasons and Biomes | 4 Comments

GLOBE after graduation: A civil engineer’s story

Many students find a love for science through the GLOBE Program.  They discover the world around them and make connections and discoveries that they may not have otherwise found.  And while their grade school days are limited, their experience with GLOBE is not.  Mohamed Elwan, a civil engineer working in water and water quality management, is a great example.

Mohamed Elwan, Civil Engineer and GLOBE Egypt Alumnus

Mohamed Elwan, Civil Engineer and GLOBE Egypt Alumnus

Mohamed is a GLOBE Alumnus who lives and works in Egypt.  GLOBE Alumni are former GLOBE students who work with GLOBE Country Coordinators or U.S. Partners to implement GLOBE in their local schools and community.  Mohamed joined the GLOBE Program as a student in 2001 and it ignited his passion for environmental science.  Because of this passion, he pursued a career in civil engineering where he can use his excitement every day in his career.

GLOBE Students, who are all now GLOBE Alumni, perform protocols in 2001. The students from left to right are Mohamed Abdel Fattah, Mohamed Saad and Mohamed Elwan.

GLOBE Students, who are all now GLOBE Alumni, perform protocols in 2001. The students from left to right are Mohamed Abdel Fattah, Mohamed Saad and Mohamed Elwan.

Like many others in the environmental sciences, his career has taken many turns.  But through it all, he has stayed true to his passion for making a positive impact on the environment.  His civil engineering career started through design and building water and waste water tanks.  He then transitioned into a position that worked closely with a project at Cairo’s airport and now has settled in as a quality control/quality analyst for a consulting firm who specializes in environmental and infrastructural (such as highway and systems) studies in the Middle East.

Through his work, he has found excitement in knowing that he gets to work in the details of water and waste water projects to make plans that will change people’s lives.  As each project differs from the previous, he draws on his experience with GLOBE and his desire to help the environment to make sure each project is completed the right way.  He knows that his work is important, as he said “every non-scientist knows how important [water is] to our life.”

And while his GLOBE experience has helped him in his career, becoming a GLOBE Alumnus has presented opportunities that he may not have otherwise experienced.  He was able to attend a lecture by NASA Administrator Charles Bolden at the American University in Egypt, visit the Siwa Oasis, and attend the Near East and North Africa Regional Meeting in the Kingdom of Bahrain in 2003.  What future opportunities will present themselves to Mohamed? Only time will tell.

Mohamed at the Siwa Oasis

Mohamed at the Siwa Oasis

Mohamed and members of the GLOBE Lebanon team at the 2003 Near East and North Africa Regional Meeting in the Kingdom of Bahrain

Mohamed and members of the GLOBE Lebanon team at the 2003 Near East and North Africa Regional Meeting in the Kingdom of Bahrain

Suggested activity: Are you a former GLOBE student who would like to reconnect with the GLOBE Program?  Visit the GLOBE website to register as a GLOBE Alumni.  If you’ve also pursued additional education or a career as a scientist, consider joining the GLOBE International Scientist Network.  You can find more information on criteria for membership here.


Posted in GLOBE Alumni, Near East and North Africa | 2 Comments

Why do you “Do GLOBE”?

This month, we at the GLOBE Program Office (GPO) in Boulder, Colorado are asking the worldwide GLOBE community one simple question: “Why do you do GLOBE?”.  They have shared their answers with us by recording a short video (using a cell phone camera). Then they are uploading short video clips directly to our website. Here’s what we are learning: The reasons why people do GLOBE around the world is as diverse as the community who participates in the Program. And, now it’s your turn to join the fun.

When GLOBE students from around the world gathered at the 17th Annual GLOBE Partner Meeting in Maryland, USA (August 11-16) to share research and make new friends, a large group of female students from Croatia, Nigeria and the United States made an “I Do GLOBE” video in which they stated, “We do GLOBE because it brings us all together.” followed by laughter from the entire group and some on-lookers.

After making the video, the girls from the United States teach the others some new country line dancing moves

After making the video, the girls from the United States teach the others some new country line dancing moves

Ylliass Lawani, GLOBE Alumni from Benin, does GLOBE because he likes science, because he likes the environment and because he likes to smile. He didn’t know a program like GLOBE could teach him as much as it has and gave him the ability to practice leadership.

Ylliass during the 2013 GLOBE Africa Regional Meeting

Ylliass during the 2013 GLOBE Africa Regional Meeting

Maria Lorraine de Ruiz-Alma, Country Coordinator for the Dominican Republic and teacher at Notre Dame School, told us that she does GLOBE because she loves nature and by doing GLOBE, she can feed her curious mind with its wonders, understanding that we are part of a system that we can influence and where we share the responsibility to preserve and protect.

Amarachi (GLOBE Student from Nigeria), Maria, and Dr. Jim Washburne during the 17th Annual GLOBE Partner Meeting

Amarachi (GLOBE Student from Nigeria), Maria, and Dr. Jim Washburne during the 17th Annual GLOBE Partner Meeting

Dr. Jodi Haney, GLOBE U.S. Partner at Bowling Green State University, says she does GLOBE because we only have one Earth. She believes it is our responsibility to be good stewards of the earth, and a way to do that is through GLOBE.  Monitoring the earth and sharing our collective observed data gives us all the ability to more fully understand the implications of our actions.

Maria and Nigerian Student Amarachi and Dr. Jim Washburne during the 17th Annual GLOBE Partner Meeting

Dr. Jodi Haney and her students during the 2nd Annual Student Research Exhibition

Now, we want to hear from you.

Step 1: Use your cell phone video camera and video tape yourself finishing this sentence: “I Do GLOBE because …”. Keep the video short; 30-seconds is perfect.

It's easy to make a video - just have a friend tape you while you finish the sentence: "I Do GLOBE because..."

It’s easy to make a video – just have a friend tape you while you finish the sentence: “I Do GLOBE because…”

Step 2: Upload your video(s) to our website.

Step 3: Check out our Facebook and YouTube channels to watch yourself and others in action.

Be creative and have fun recording your video and let the world know why you Do GLOBE.

Suggested activity: Go to our webpage and watch the video we put together for you. It might inspire you or spark some ideas for the video you create. After you videotape your own video, upload it directly to the same page of our webiste

Posted in Events | 11 Comments

GLOBE Students Present Their Research, Part II: The 2nd Annual Student Research Exhibition

Last week we highlighted the 2013 GLOBE Virtual Student Conference, a showcase of student research being performed using GLOBE protocols.  This week, the focus is on the 2nd Annual Student Research Exhibition, an event that features GLOBE Country Coordinator or U.S. Partner sponsored student research projects.

Last year, the 1st Annual Student Research Exhibition (formerly the Student Science Symposium) was held in St. Paul, Minnesota in conjunction with the 16th Annual GLOBE Partner Meeting.  After the great success of the event, the decision was made to make it an annual event in an attempt to involve GLOBE Students in the GLOBE Partner Meetings.  In May of 2013, the call for nominations for student research projects to participate in this event was sent to all GLOBE Country Coordinators and U.S. Partners in the hopes that this event would include the top research from each area.

The 2nd Annual Student Research Exhibition event was held on Monday, 12 August, 2013 in conjunction with the 17th Annual GLOBE Partner meeting in Hyattsville, Maryland, USA.  Ten countries participated in the one night event, which included over 70 students from all grade levels.  Those ten countries, Argentina, Croatia, Madagascar, Nigeria, Norway, Peru, Saudi Arabia, Thailand, United States, and Uruguay , represented all GLOBE regions, and schools presented their research either in-person, through a poster presentation, or virtually, via either a video or PowerPoint presentation.  Additionally, each of the 33 research projects performed protocols in at least one of the 5 GLOBE investigation areas.

A student from Saudi Arabia presents her research during the 2nd Annual Student Research Exhibiton

A student from Saudi Arabia presents her research during the 2nd Annual Student Research Exhibiton

In addition to the breadth of research topics and protocols used, students approached their research differently.  One student worked on her own to understand sea surface temperature.  There was a group of students who explored how they could harness fresh water for use at their school.  Another project was collaborative between three countries, Argentina, Peru, and Uruguay, and it explored how ENSO and human activities are affecting their land cover.  While these are just a sampling of the projects, each research team presented outstanding research to the greater GLOBE community.

All student projects were judged on pre-determined criteria by members of the GLOBE International Scientist Network.  The projects were judged on a maximum of 100 points in the areas of creative ability, use of GLOBE data, scientific expression, thoroughness, knowledge achieved and clarity.

With these criteria in mind, the following projects were the winners of the 2nd Annual Student Research Exhibition.

In third place, representing the country of Croatia and the GLOBE Europe and Eurasia Region was the project entitled Water quality and the revitalization potential of Mrtvi Kanal Channel, studied by students at Medicinska skola u Rijeci.

Students from Medicinska skola u Rijeci stand with their teacher in front of their poster

Students from Medicinska skola u Rijeci stand with their teacher in front of their poster

In second place, representing the country of Thailand and the GLOBE Asia and Pacific Region was the project entitled Measured concentration of nitrate in water from the bulb of Wetland plan Nepnthes in Bung Khong Long, Thailand, studied by students at Bung Khong Long Wittayakom School.

Students from Bung Khong Long Wittayakom school accept their second place award with their teacher

Students from Bung Khong Long Wittayakom school accept their second place award with their teacher

And in first place, representing the country of the United States and the GLOBE North America Region was the project entitled Correlations between vernal pool phenology and a breeding population of Bufo americanus in Dearborn Heights, Michigan, studied by students at Crestwood High School.  You can read a summary of this winning project here.

Students from Crestwood High School show off their award with GLOBE Program Office Scientist Jessica Mackaro

Students from Crestwood High School show off their award with GLOBE Program Office Scientist Jessica Mackaro

The GLOBE Program would like to extend a big thank you to all of the scientists, teachers and students who were involved in this fantastic event.

If you’ve been performing research, you don’t need to wait for the Virtual Student Conference or the Student Research Exhibition to share your research with the GLOBE Community.  You can submit projects year round through the “Tell Us About It” link on your school’s page.  Additionally, if you’re a scientist who would like to be involved in The GLOBE Program, be sure to visit the GLOBE International Scientist Network page to find out more information.

Posted in Competitions, Conferences/Meetings | 9 Comments