GLOBE Students Present Their Research, Part I: The 2013 GLOBE Virtual Student Conference

One of the most exciting aspects of The GLOBE Program is the ability for students to perform scientific research.  This is exemplified through GLOBE’s mission statement, which is stated on the GLOBE website: “to promote the teaching and learning of science; enhance environmental literacy and stewardship; and promote scientific discovery.” Students’ scientific discovery comes through hands-on experiences, i.e. taking Earth System Science measurements to answer a question that is important to them.

The Student Climate Research Campaign, which began in September of 2011, aimed to do just that.  Through the campaign, students became engaged in measuring, investigating, and understanding their local environments.  GLOBE students who have been participating in the campaign are diligent in uploading their data to the GLOBE database and have been using that data to plan and carry out exciting research projects to explore their environments.

The 2013 GLOBE Virtual Student Conference, occurring from 06-31 May 2013, was the place for GLOBE students of all grade levels to showcase the research they have been performing through the Student Climate Research Campaign.  58 projects from 4 countries (Argentina, Madagascar, Thailand and the United States) were submitted to the conference.  Scientists from the GLOBE International Scientist Network  scored the projects using a modified Intel International Science and Engineering Fair Evaluation Criteria to determine an overall winner, as well as winners for each region that participated.

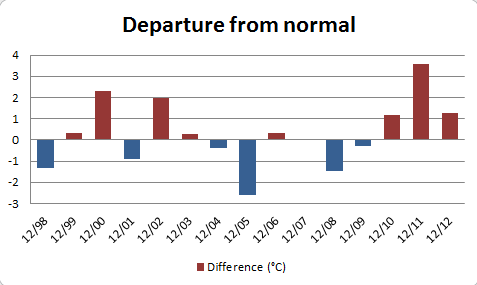
The overall winner of the 2013 GLOBE Virtual Student Conference was Ms. Marcy Burns’ fifth grade students from Main Street Intermediate School in Norwalk, Ohio, U.S.A.  These students discovered that over the past thirty years, the average annual precipitation in their town has increased. Because of this, they hypothesized that runoff would have a negative effect on the water in the stream. Water samples were collected on the east and west sides of Norwalk, Ohio, for four weeks and tested for pH, nitrate-nitrogen, and conductivity. After looking carefully at the data, they concluded that pH and nitrate-nitrogen were not affected very much by runoff, but conductivity increased after the roads were salted.  The students felt that additional testing during all seasons would be needed to completely understand the relationship between runoff and water quality.  You can read their report on the GLOBE website and watch their project video below.

Congratulations to the students from Main Street Intermediate School for a wonderful project.  To see the winners from the participating regions, visit the Winning Projects page on the GLOBE website.  Additionally, all projects are still available for viewing.  You can browse through the projects on the 2013 GLOBE Virtual Student Conference page.

Suggested Activity: Please be sure to visit The GLOBE Scientists’ Blog next week as we explore the second piece in this series about GLOBE students presenting their research at the 2nd Annual Student Research Exhibition, which occurred in conjunction with the 17th Annual GLOBE Partner Meeting on 12 and 13 August 2013 in Hyattsville, Maryland, U.S.A.

Posted in Competitions, Conferences/Meetings | 1 Comment

The power of networking

Next week, The GLOBE Program expects to see 250 members of the GLOBE community in attendance at the 17th Annual GLOBE Partner Meeting. GLOBE partners, scientists, teachers, students, and other community members from 27 countries will travel to Maryland for the weeklong meeting.

Partners at GLOBE Annual Meeting

Figure 1. GLOBE Partners from across the United States meeting together at a past GLOBE Annual Meeting.

The excitement leading up to a conference like the GLOBE Annual Meeting reminds me of my first scientific conference that I attended when I was an undergraduate student. I can only imagine how the 63 GLOBE students that will attend the Annual Meeting next week must feel!

I remember how overwhelmed I felt by the number of talks one could attend and the number of people speeding up and down the halls trying to make it to as many of their selected talks as possible.  Beyond the scientific presentations of that particular meteorology conference, I was also amazed to see the vast number of organizations represented in the conference exhibit hall.  From private instrument manufacturing companies to big name national research labs to contractors, I realized my understanding of the careers and opportunities in the world of meteorology was only in its infancy.

Luckily, I went to this meeting accompanied by other students from my school, a few with more conference and professional experience to show me the ropes.  As we walked around the exhibit hall, one of my colleagues seemed to know everyone! People greeted her as we passed, and many stopped to talk to her. The networking connections I saw her engage with that day even helped me get started on my career path.

Because I recognized that summer research internships were a very important way to get vital experience for joining the scientific workforce, my ambition for the following summer was to do a research internship.  I had my sights set on participating in a certain premier summer research experience, which was at a school very well known for severe storms research (exactly what I was interested in). I was also sure I wanted to attend this institution for graduate school.  Even so, my well-connected colleague encouraged me to seek out a few other opportunities for a summer research experience and graduate school, and even helped me navigate around the booths in the exhibit hall to gather pamphlets about each.  After the conference, I applied to all of the programs I found that week, plus to the one I had my heart set on.

This networking experience led my career path in a completely different direction from what I originally thought it would be, since I ended up choosing to participate in a different summer research experience and I attended one of her suggested graduate schools.  I am very happy with my choices, which I feel have broadened my horizons much beyond where I would be if I had stuck to my original plan.

Almost 15 years from that fateful conference, I am now a scientist at the National Center for Atmospheric Research and hold a split appointment as a scientist with The GLOBE Program.  My fairly unique split appointment is yet another example of the power of networking.  As I started my scientific research career after obtaining my Ph.D. in Atmospheric Science, I discussed my interests with many colleagues until finally I made the connection that gave me this opportunity to pursue my interests in both scientific research as well as science education.

GLOBE staff and teacher at AMS conference

Figure 2. GLOBE Science and Education Team staff, including myself, with a GLOBE teacher at the American Meteorological Society conference exhibit hall.

I am grateful for having many connections with people in my field and believe that similar networking opportunities, such as the GLOBE Annual Meeting and networks like the GLOBE International Scientist Network (GISN), can help scientists, educators, and students in the GLOBE community connect and contribute to the vision of GLOBE.

So whether you are a GLOBE student, scientist, teacher, or community member, and whether you are attending next week’s GLOBE Annual Meeting or another conference down the road, keep in mind the benefits that networking with your colleagues can have on your career.  And also remember that there are plenty of young me’s out there in need of the eye-opening guidance that networking can provide.

GLOBE community members at GLOBE meeting

Figure 3. GLOBE scientists, trainers, and student alumni at a past GLOBE Annual Meeting.

Traveling to the GLOBE Annual Meeting next week? Upload your “I do GLOBE” video here

Are you a scientist interested in working with students?  Join the GLOBE International Scientist Network (GISN)!  For more information on how to join the GISN, click here.

Posted in General Science | 1 Comment

Zero is still a measurement

Zero is a fascinating word and concept.  The concept of zero can be attributed to mathematicians in India over a thousand years ago.  Jaina mathematicians may have been the first to use the word shunya (meaning void in Sanskrit) to refer to zero.  The concept of zero travelled quickly through philosophical and mathematics worlds, as many cultures were struggling with the concept of “nothing” in mathematics.  Some mathematicians and philosophers referred to this concept as one of the greatest inventions or discoveries in the history of mankind, rivaled only by the invention of the wheel.

Why is zero so important?  Mathematically, zero is often used in reference to calculations and measurements.  In the scientific world, we often consider mathematics as the language of science; therefore, in science it also refers to a calculation or a measurement.  In many cases, knowing the absence of something is sometimes just as important as knowing the presence of something, such as migrating animals or even rainfall.

Let’s look at two real world examples that indicate how important zero is to Earth science:

First, let’s look at the Marshall Islands: The Marshall Islands, a collection of coral atolls and low-lying islands in the North Pacific, are undergoing a unique climate shift.  These islands, which comprise about 181 square kilometers of land, are experiencing extreme drought and extreme flooding simultaneously.  The following two pictures were taken only a month apart, but on two different islands, depicting two very different conditions.

Flooding in Majuro, Marshall Islands, June 2013. Photo taken by Anole Valdez, 2013.

Drought in the northern islands from May 2013. Photo from UN.org.

To put these two extreme events in perspective, observe the following map of the Marshall Islands.

Map of the Marshall Islands, from cia.gov

If only one atmospheric station reported data in a situation like this, then one could assume that the entire country was experiencing the same weather; Additionally, if atmospheric observers didn’t value the submission of zero rainfall and only reported data when there was rainfall, those not directly connected to these islands might think that it always rains and on certain days, observers fail to report their data.  That is obviously not the case, as can be seen in the two photos.  It’s important to collect and submit all observations to understand the entire scenario.

Second, let’s look at the Great Lakes region of New York State: In September of 1996, flooding occurred north of Buffalo, New York due to a lake effect rain event.  A lake effect rain occurs when the air temperature is much colder than the water temperature of a nearby lake.  As the cold air passes over the warm lake, some of the lake’s water evaporates and precipitates out (as either rain or snow, depending on how cold the air temperature is) over areas downwind of the lake.  In this specific example from 1996, Lake Erie observed water surface temperatures of 22.8°C, while the air temperature overnight was around 8°C.  As you can see by the radar image below, there was only a small area of land that experienced this extreme weather event (within the circle).

Lake effect rain event on the northern coast of Lake Erie which occurred in 1996.  Photo from NOAA.

Lake effect rain event on the northern coast of Lake Erie which occurred in 1996. Photo from NOAA.

In meteorology and climate research, it is just as important to know when rain does not occur as when it does.  Therefore, when you check your rain gauge or snow board you are collecting data on how much rain or snow fell.  Noting zero rainfall in the rain gauge is as valid and important as noting that the cloud cover is “No Clouds” (0% cloud cover) or zero Hummingbirds were observed at the feeder.

Consider this: a desert is a place with little or no rain and is indicative of a location’s climate; a drought is a time when little or no rain falls, and is indicative of a longer term weather pattern.  Knowing when and where precipitation falls is significant in understanding the environment, as it helps to distinguish between whether or not a location is a desert or is only experiencing drought.  What this means in practice is that if you observe nothing in your rain gauge you should report zero for liquid precipitation.

If you see that there is no precipitation in the rain gauge, leaving that field blank is not the same as noting that no rain was in the rain gauge.  If you report zero, others will be certain that there was no rainfall and a zero will show on the map for your site.  Having your measurement of zero included in the day’s dataset improves the contours on the visualization and helps everyone recognize the true extent of GLOBE student observations and contributions to environmental knowledge.

Suggested activity:  Ask a friend, parent or teacher to describe the importance of zero in his or her daily activities.  Does zero have value in your life?  We hope through this post that you understand how valuable an observation of zero really is.  On your next visit to your atmosphere site, please be sure to take note of your rain gauge and report your rainfall amount, even if it’s zero.

Posted in Asia and Pacific, General Science, North America | 5 Comments

GLOBE’s long history – what can you learn from GLOBE’s long-term data?

GLOBE celebrated its 18th birthday on Earth Day, 22 April 2013.  This means that, in some cases, you can look at nearly 18 years of data collected through the years by GLOBE students.   One school, Zakladni Skola – Ekolog. Praktikum in Jicin, Czech Republic, has been collecting data since 1995.  While the typical climate study requires at least 30 years of data, it is possible to examine short-term changes in a local environment and compare that to a longer period.

The following image is a look at each December’s monthly average temperature, beginning in 1995.  The black line represents the temperature trend over the seventeen years that this school has collected data – an estimated increase of .1601°C over the 17 year period.

A timeseries showing December monthly temperatures from 1995-2011 for Zakladni Skola - Ekolog. Praktikum in Jicin, Czech Republic; All data is GLOBE student collected data.

A timeseries showing December monthly temperatures from 1995-2011 for Zakladni Skola – Ekolog. Praktikum in Jicin, Czech Republic;
All data is GLOBE student collected data.

Using this knowledge, and setting the base 10 year reference period of 1998-2007, it is easy to calculate the short-term average for this station to determine the departure from that average.  The average temperature for December is 0.211°C.  This average is easy to calculate.  First, you calculate the average daily temperature by averaging the observed maximum and minimum temperatures.  Then, you average the daily average temperatures together to obtain the average temperature for the month of December.  Once you’ve done that for each of the Decembers from 1998-2007, you can average those together to get your average December temperature.  From here you can examine how each December departs from that average, and put it into graphical format, like below.

Dec2011Anomalies

Departure from 10 year (1998-2007) average December temperature for Zakladni Skola – Ekolog. Praktikum in Jicin, Czech Republic; All data is GLOBE student collected data

Notice that at the beginning of the time period the occurrence of below normal temperatures was more common.  As time progressed, temperatures became more above normal, which supports the trend in monthly temperature.  Globally, the month of December 2011 was the 322nd consecutive month where global average temperature was above the 20th century normal – the last month that was below normal across the globe was February 1985.

Another school, Primarschule Neufeld in Thun, Bern Switzerland, has been collecting atmosphere data since 1998.  The graph below shows the monthly average temperature for each December since 1998, which indicates a positive temperature trend of 0.088°C over the entire time period.

A timeseries showing December monthly temperatures from 1998-2012 for Primarschule Neufeld in Thun, Bern Switzerland; All data is GLOBE student collected data

A timeseries showing December monthly temperatures from 1998-2012 for Primarschule Neufeld in Thun, Bern Switzerland;
All data is GLOBE student collected data

Using the same base 10 year reference period of 1998-2007 as we did for the school from the Czech Republic, it is found that the average temperature for December for the school in Switzerland is 1.101°C.

Departure from the 10 year (1998-2007) average December temperature for Primarschule Neufeld in Thun, Bern Switzerland; All data is GLOBE student collected data.

Departure from the 10 year (1998-2007) average December temperature for Primarschule Neufeld in Thun, Bern Switzerland; All data is GLOBE student collected data.

It is very important, as a member of the GLOBE community, to continue building this observational record for your site.  Every data point is important in describing the bigger picture.

Suggested activity: Over the next 12 years, GLOBE students will collect enough data to be able to examine long-term changes in variables such as air temperature.  However, you can start examining your data, or data of a nearby school now.  You can even examine the data from these two schools to look at the trends for June.  What do you think you will find? We’d love to hear from you.  Leave us a comment, send us an email or get in touch on our Facebook Page.

Posted in Climate, Data included, Earth System Science, Europe and Eurasia, Great Global Investigation of Climate | 1 Comment

Next Generation Science Standards: from gaps to greats

This week’s blog post is a cross-post from the SmartBlog on Education, discussing Next Generation Science Standards (NGSS) and gap analysis.  Various GLOBE Partners, such as Dave Bydlowski and Marcy Seavey, have been very active in the NGSS and suggested this blog post to us to share with our community.  This blog was originally posted on http://smartblogs.com/education/2013/06/26/ngss-curriculum-development-from-gaps-to-great/ and was written by Fred Ende and Adam Percival.

Now that the Next Generation Science Standards have been released and many states are considering adoption, a question that many science educators are pondering is: “How can I tell whether resources are aligned to the new standards?”

Let’s look at how we might begin to answer that question. Suppose we had this fifth-grade performance expectation (PE):

5-ESS2-2. Describe and graph the amounts and percentages of water and fresh water in various reservoirs to provide evidence about the distribution of water on Earth.

A first step might be to check whether students have the opportunity to meet this expectation in the current curriculum through a series of learning investigations that asks students to use information about the different reservoirs of water on Earth — oceans, lakes, ice caps, etc. — and make a graph from it. A gap analysis describing the alignment of the curriculum to each standard is one way to accomplish this.

Sample gap analysis created for fifth-grade curriculum.  Image created by Fred Ende.

Sample gap analysis created for fifth-grade curriculum. Image created by Fred Ende.

However, educators must remember that identifying gaps such as in the above example is only a first step. The Next Generation Science Standards are performance expectations for assessments (both statewide and at the classroom level), and not a curriculum. So, while pre-existing learning investigations may be an acceptable way to meet this PE, they are also not the only way to address it. From here, educators need to think about whether alignment is simply massaging current curriculum to fit PEs, or whether a gap analysis provides for some truly innovative opportunities. For example, it would also be possible to craft a project-based unit on the water cycle, perhaps including an investigation of local waterways, constructing models of the local watershed, and embedding an engineering project to create a device to improve water quality. This big picture approach moves from a standard gap analysis to an integrated design where the foundations of the NGSS can truly be seen in action. In fact, this sample unit could be used to address both the standard above and three others in fifth grade:

5-ESS2-1. Develop a model using an example to describe ways the geosphere, biosphere, hydrosphere, and/or atmosphere interact.

5-ESS3-1. Obtain and combine information about ways individual communities use science ideas to protect the Earth’s resources and environment.

3-5-ETS1-1. Define a simple design problem reflecting a need or a want that includes specified criteria for success and constraints on materials, time, or cost.

Units such as these not only ensure that required disciplinary core ideas are “covered” at the appropriate level, but also address many other important considerations, such as directly engaging students in scientific and engineering practices, and assisting students (and teachers) in seeing the disciplinary (and interdisciplinary) connections the cross-cutting concepts provide. This is where the original graphing activity starts to fall short, because in isolation it might meet the “letter” of the practice “Using Mathematics and Computational Thinking” but it doesn’t quite attain the “spirit” of having students engage in multiple practices in an authentic context, as scientists and engineers do. In fact, under our revised unit design, the graphing activity might actually become a performance-based assessment task at the end of the unit (or a formative measure during the unit) rather than an activity designed to teach the material to be learned.

This distinction between curriculum and assessment is very important, because it means that to determine alignment in many cases we need to look at the vision of the NGSS, including use of the three dimensions — Disciplinary Core Ideas, Cross-Cutting Concepts, and Scientific and Engineering Practices –, integration with the common core ELA and math standards, and a focus on depth of coverage over breadth. At this year’s National Science Teachers Association conference in San Antonio, Ted Willard from NSTA shared an ongoing project to create rubrics for the NGSS similar to the tri-state rubrics for Common Core alignment. Rubrics such as these which take into account multiple factors are one method of avoiding an overly narrow focus on alignment to the letter rather than the enduring purpose of the NGSS.

In conclusion, alignment to the Next Generation Science Standards is a complex topic, and will likely mean very different things to different people. However, alignment must mean more than just “checking boxes” or a simple “crosswalk” from old standards to new. After analyzing existing resources using techniques such as a gap analysis, educators need to think long and hard about whether the curriculum truly meets the intentions of the K-12 Framework for Science Education and NGSS, and what alterations would be needed if it does not.

Suggested Activity: Join Dave, Marcy and the GLOBE Program Office for a webinar on Thursday, 18 July at 17:00 UTC (1 pm EDT/12 pm CDT/11 am MDT/10 am PDT).  This webinar marks the first in a series of aligning the GLOBE Program with Next Generation Science Standards.  Find out more information on the webinar here.


Posted in General Science | Leave a comment