GLOBE Research Ideas - Eclipse


GLOBE Research Ideas
A solar eclipse provides a unique opportunity for scientists to study the effects of the Sun’s radiation on the Earth’s surface. Explore the studies below to get inspired to explore science during the eclipse:
Wind Direction and Temperature Changes During Eclipses
Dr. Suzanne Gray, from the University of Reading, who led a study on wind changes during a 2015 eclipse over the United Kingdom, called the event a “giant natural experiment.” Data collected by automated weather stations and citizen scientists during that eclipse showed some places experienced air temperature drops of up to 3° Celsius at the height of the eclipse. (See the paper "The National Eclipse Weather Experiment: An assessment of citizen scientist weather observations" for more details.)


Maps displaying the measured temperatures (top) and temperature anomaly (bottom) estimated from the National Eclipse Weather Experiment (NEWEx) observations on 20 March 2025, at the times of 0830, 0940 and 1030. The times 0830 and 1030 are the closest observation times corresponding to the times of first contact and fourth contact, respectively, and 0940 is the mean time when, according to the NEWEx data, UK sites experienced a maximum temperature anomaly. The mean of the maximum temperature anomalies was −2.2 ± 0.3°C. Image credit: Barnard, et al.
Cloud Cover and Temperature Changes During Eclipses
Dr. Brant Dodson, of the GLOBE Clouds team at NASA's Langley Research Center, looked at the air temperature data from GLOBE citizen science participants during the eclipse on 21 August 2017, and analyzed the differences for locations with different categories of cloud cover. You can see some of the graphs from his paper, "Eclipse across America: Citizen Science Observations of the 21 August 2017 Total Solar Eclipse," below.
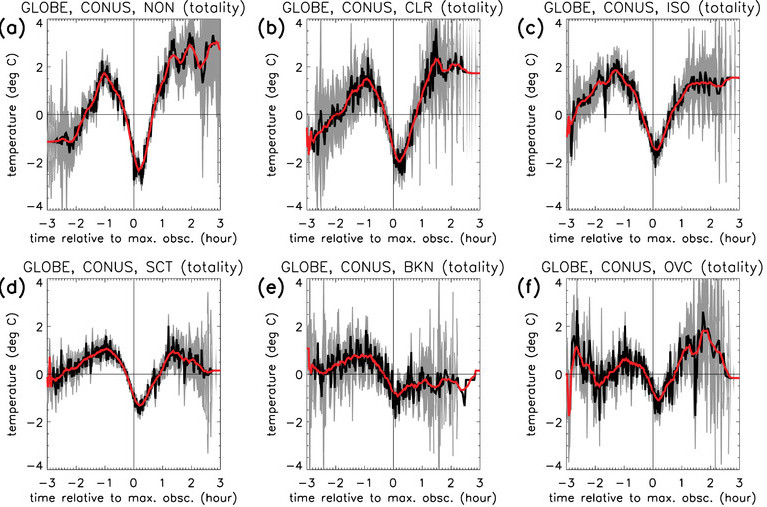
The composite time series of temperature change from GLOBE observations for the continental United States (CONUS) data subdivided into 1° longitudinal bins along the path of totality and then grouped by prevailing cloud-cover amount: (a) none, (b) clear, (c) isolated, (d) scattered, (e) broken, and (f) overcast. Black or red lines are the unsmoothed or smoothed composite time series of the composites, respectively, and the gray area is the 95% confidence interval of the unsmoothed time series. Image credit: Dodson, et al.
There’s no limit to the number of research questions you could ask on topics ranging from animal behavior and soil surface temperature changes to air temperature and its connections to regional weather. We strongly suggest you discuss your research ideas on our eclipse discussion board, but we’ve also provided a few examples of protocols likely to show effects from the eclipse in the section below. We have also compiled a curated list of student papers on eclipse topics submitted to the GLOBE International Virtual Science Symposium that may give some ideas.
GLOBE Observer and the Eclipse
The GLOBE Program's app, GLOBE Observer, will have a special option to record air temperature on the days before and during the eclipse. The app will tell you what time the eclipse will occur at your location, and will prompt you to make measurements at timed intervals directly before, during, and after the eclipse, as well as to take periodic clouds observations and to report on the land cover at your location (which may affect the temperature changes.) The app will produce a special graph (see examples below) showing your observations that you can share, as well as sending the data to the GLOBE database. Learn more on the GLOBE Eclipse landing page on the Observer website.
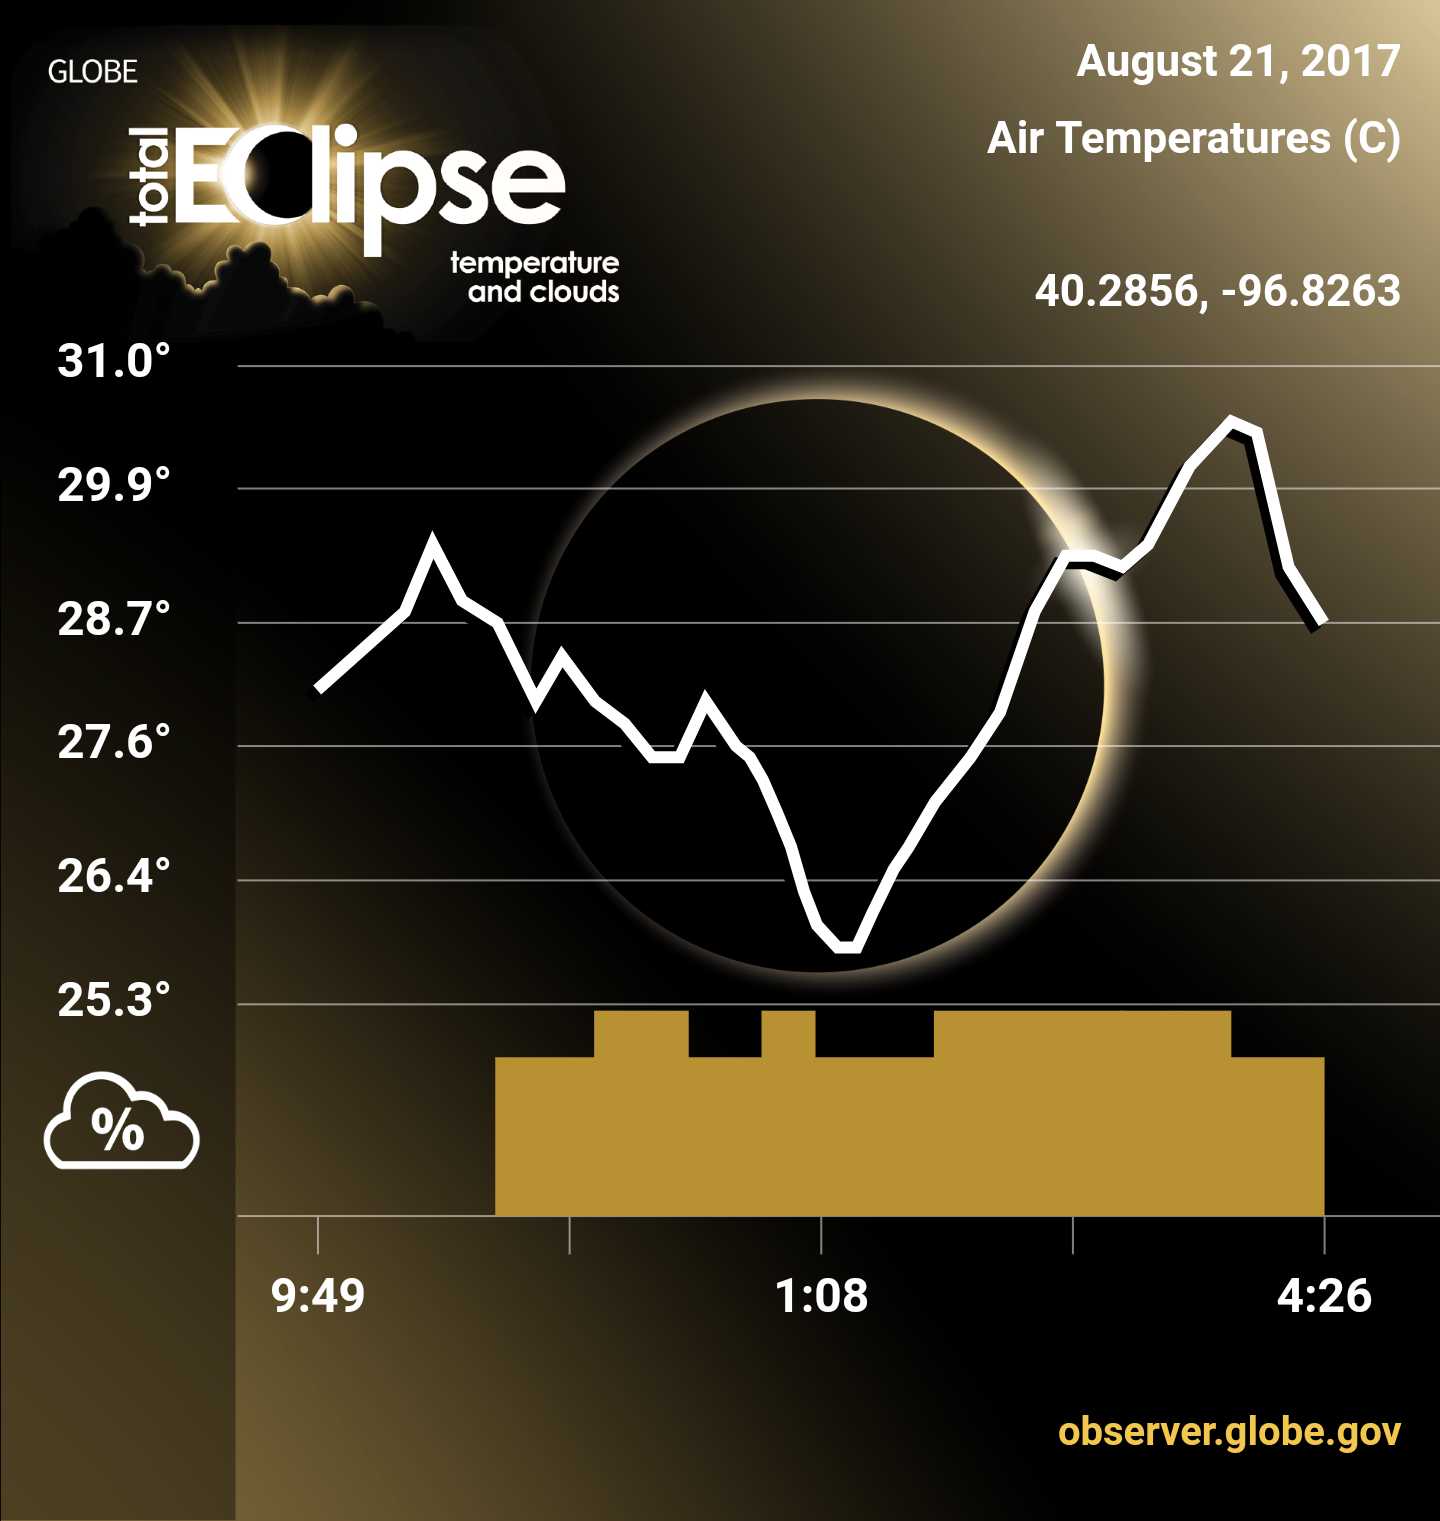
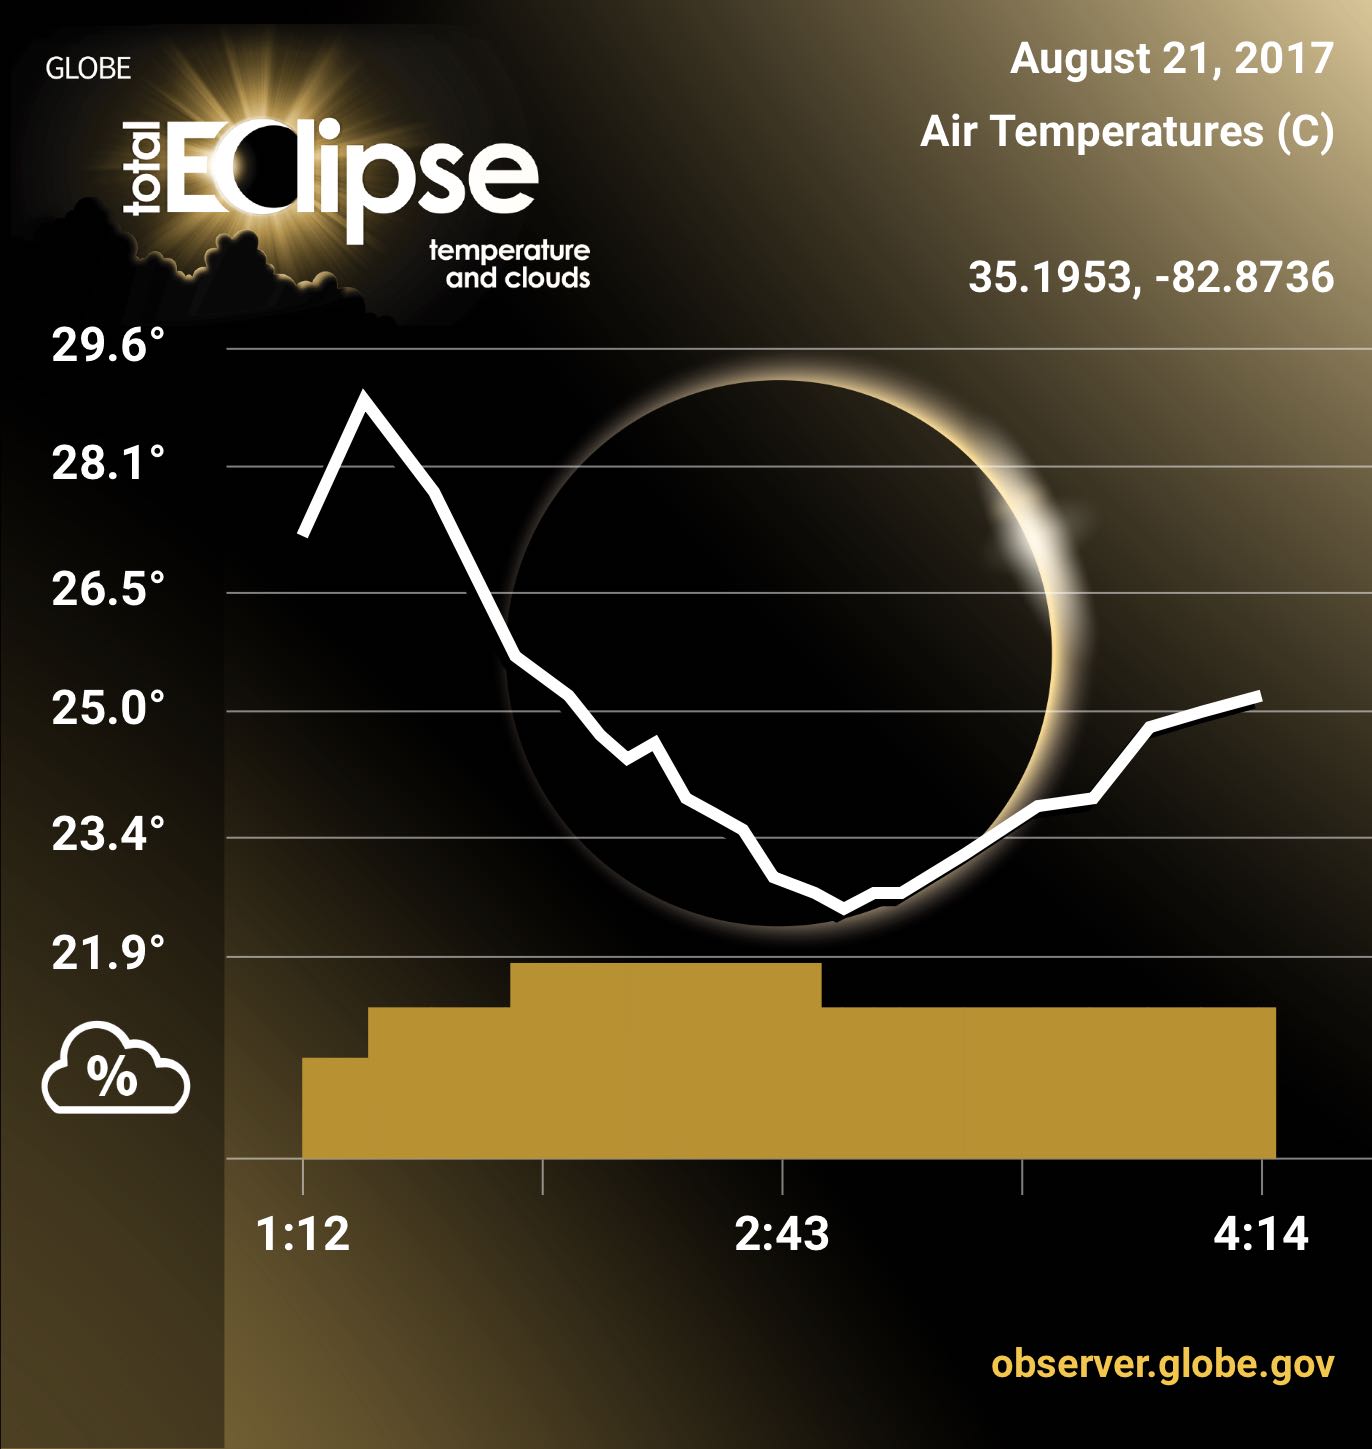
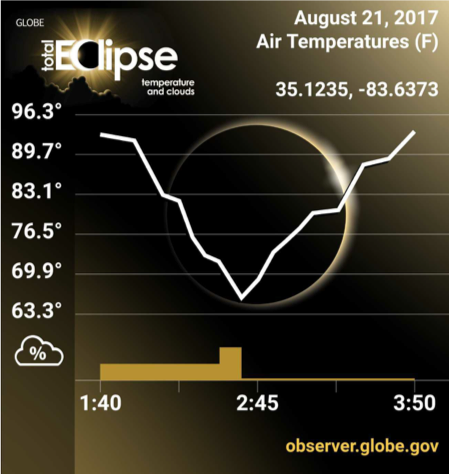
Example graphs (air temperature line graph, cloud cover percent bar graph) from individual observers using the GLOBE Observer app during the eclipse on 21 August 2017. From left, data from Beatrice, Nebraska, USA; Pisgah Astronomical Research Institute, Rosman, North Carolina, USA; Caesars Head State Park, Cleveland, South Carolina, USA.
Collect GLOBE Data During the Eclipse
While there is not an eclipse-specific GLOBE Protocol Bundle, you may find some of the resources in the Weather Protocol Bundle of use, and you can also create your own custom bundle using the Data Entry modules in the GLOBE Observer app. You can also take the opportunity to gather data using some other GLOBE Protocols and turn your observations into a unique science project! Explore the relevant GLOBE Protocols below:
Maximum, Minimum, and Current Temperature Protocol
Students can measure current air temperature using a thermometer held in the open air but in the shade for at least three minutes.
Surface Temperature Protocol
Students can measure the temperature of the Earth’s surface using an infrared thermometer (IRT). Do you think different surface types heat or cool at different rates?
Relative Humidity Protocol
Students can measure the relative humidity using either a digital hygrometer or a sling psychrometer. Why would you expect relative humidity to increase as temperatures decrease? Hint: take a closer look at the definition of relative humidity. How does it differ from absolute humidity?
Clouds Protocol
Students can observe which types of clouds and how many of three types of contrails are visible, how much of the sky is covered by clouds (other than contrails), and how much is covered by contrails. How do you think changes in relative humidity affect clouds?
Clouds Protocol
Students can observe changes in wind direction using an instrument constructed from common materials. Will you see the ‘eclipse winds?’ (Note that the linked protocol also contains instructions for the construction of an ozone monitoring shelter; these instructions can be ignored for eclipse experiments.)