
This week we have a guest blogger, Jessica Taylor. Jessica has been active as a GLOBE observer and trainer since 2001 and is a Master Trainer at NASA Langley Research Center. She conducts regular GLOBE Teacher Workshops in the areas of atmosphere and phenology investigations and works with several NASA missions to integrate GLOBE activities into their educational outreach efforts.
Whenever I talk with teachers about studying phenology, their first question is always, “What is phenology?” To me, phenology is one of the most exciting observations we can make through GLOBE. The ability to observe, first hand, the life cycles of living things and how the processes change with seasons is an amazing connection to our environment. Sometimes it can be hard to visualize the potential impacts of climate change. This makes sense, because with climate we are talking about long time scales, so thinking about how our environment may be different in 30, 100 or even 1000 years from now can be difficult to understand. However, with plant phenology, you can start tracking real-life observations that may indicate how our environment is changing now.
The GLOBE Program provides some engaging protocols for phonological data collection. Scientists have been observing these changes in the environment for years using satellite images, measuring vegetation “greenness” using the Normalized Difference Vegetation Index (NDVI). Students can observe this greening of Earth through the seasons using various web-based tools at several websites.

My NASA DATA allows students to access NDVI data and create their own color plots and time series graphs of NDVI

Satellite data can be used to monitor the health of plant life from space, and is visualized through this video (click the image to open a new window with the video) . The Normalized Difference Vegetation Index (NDVI) provides a simple numerical indicator of the health of vegetation which can be used to monitoring changes in vegetation over time. This animation shows the seasonal changes in vegetation by fading between average monthly NDVI data from 2004. The loop begins on September 24 and repeats six times during one full rotation of the globe at a rate of one frame per day. The fade for each month is complete on the 15th of each month.
The GLOBE Program also provides learning activities to facilitate the understanding of the science behind this investigation. One such learning activity is Green-up Cards. Creating your own class set of Green-Up Cards is a great way to start tracking local plant phenology. As a trainer, I have incorporated this learning activity into my workshops, but have always wanted to showcase local plant species. Teachers see the usefulness of this activity because it uses sequencing and pattern skills and helps illustrate the importance of detailed observations. Teachers often ask if there is a database of photos they can use to help train their students in determining the vegetative phases of plant development. By having GLOBE students around the world make their own Green-Up Cards, we can create a library of plant photos showcasing green-up across the globe.
NASA Langley engineer David Beals has spent time looking at plant phenology and captured the following images. These are great examples of what you can include in your Green-Up Card.
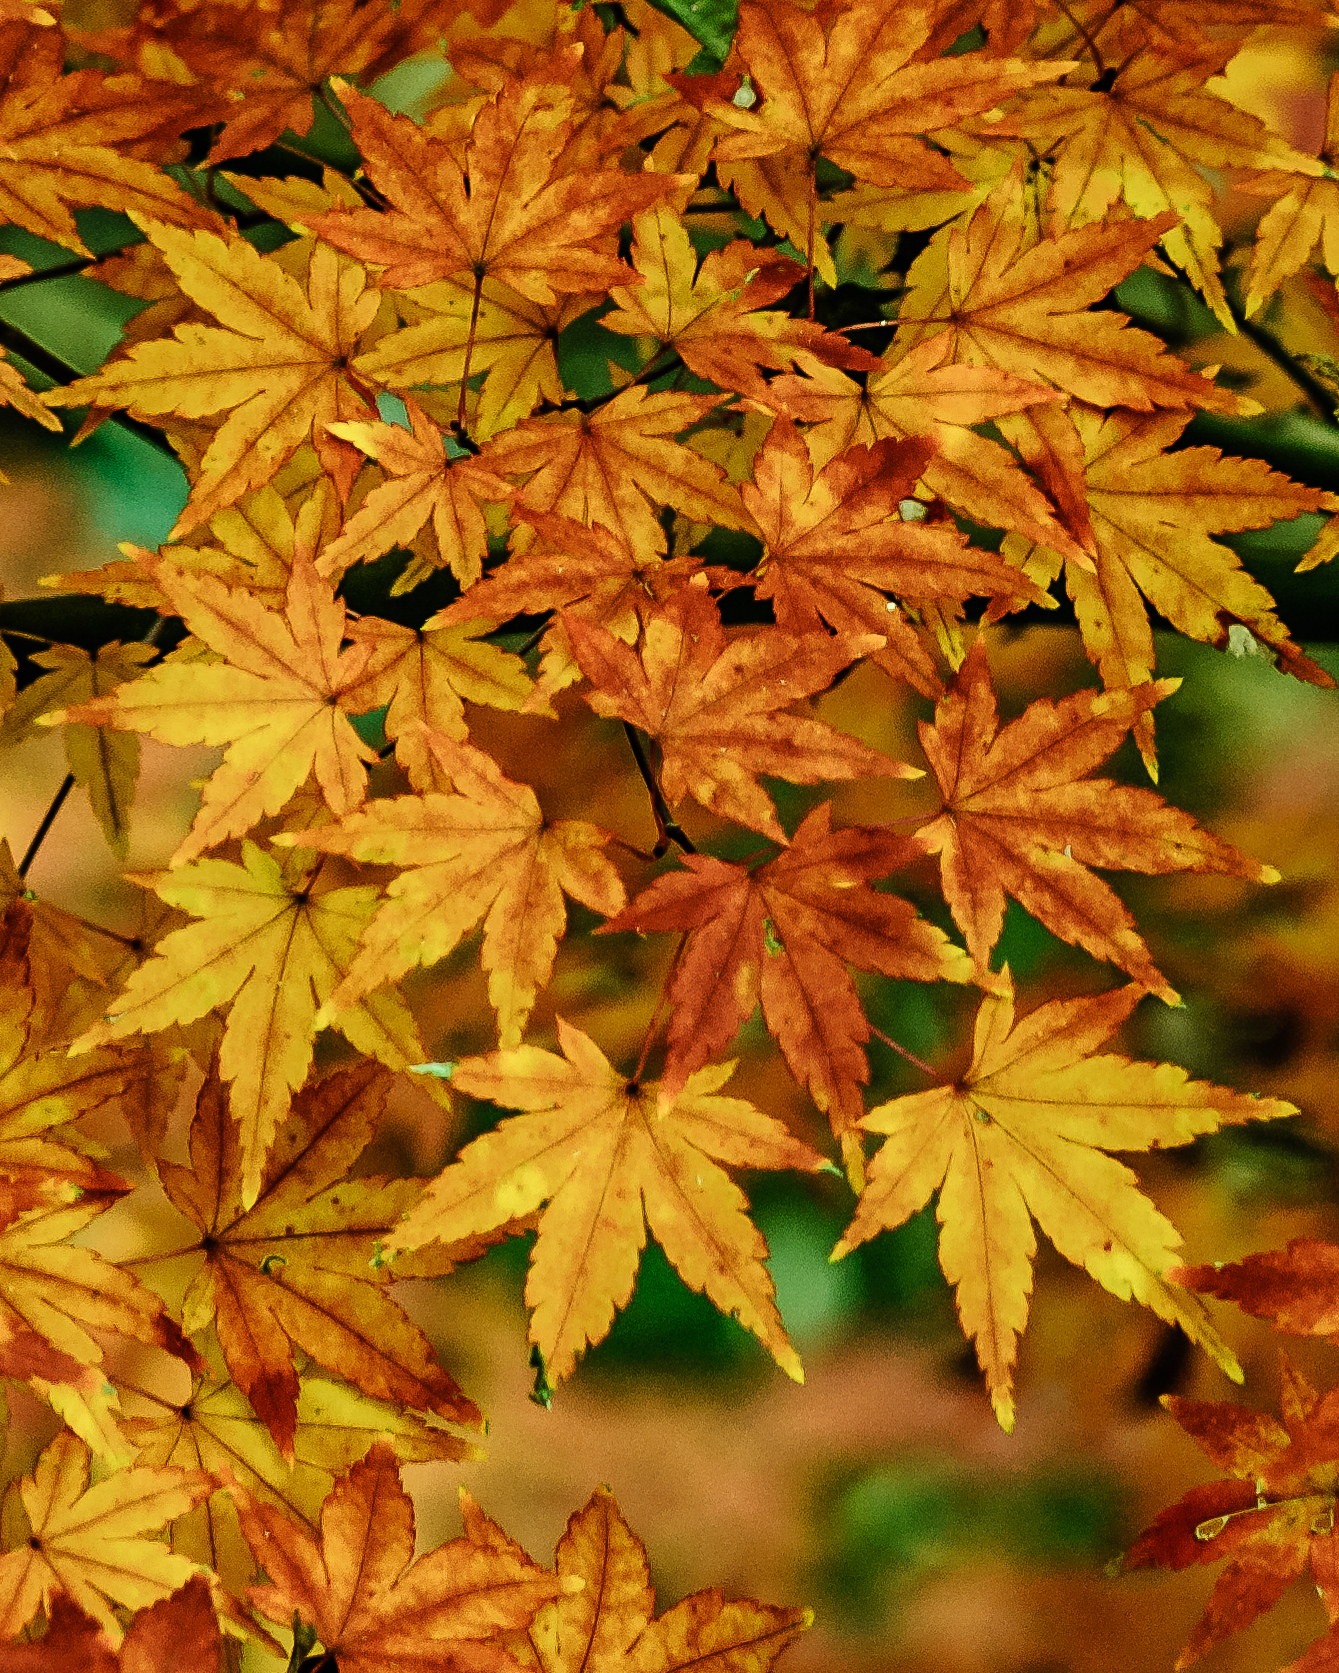
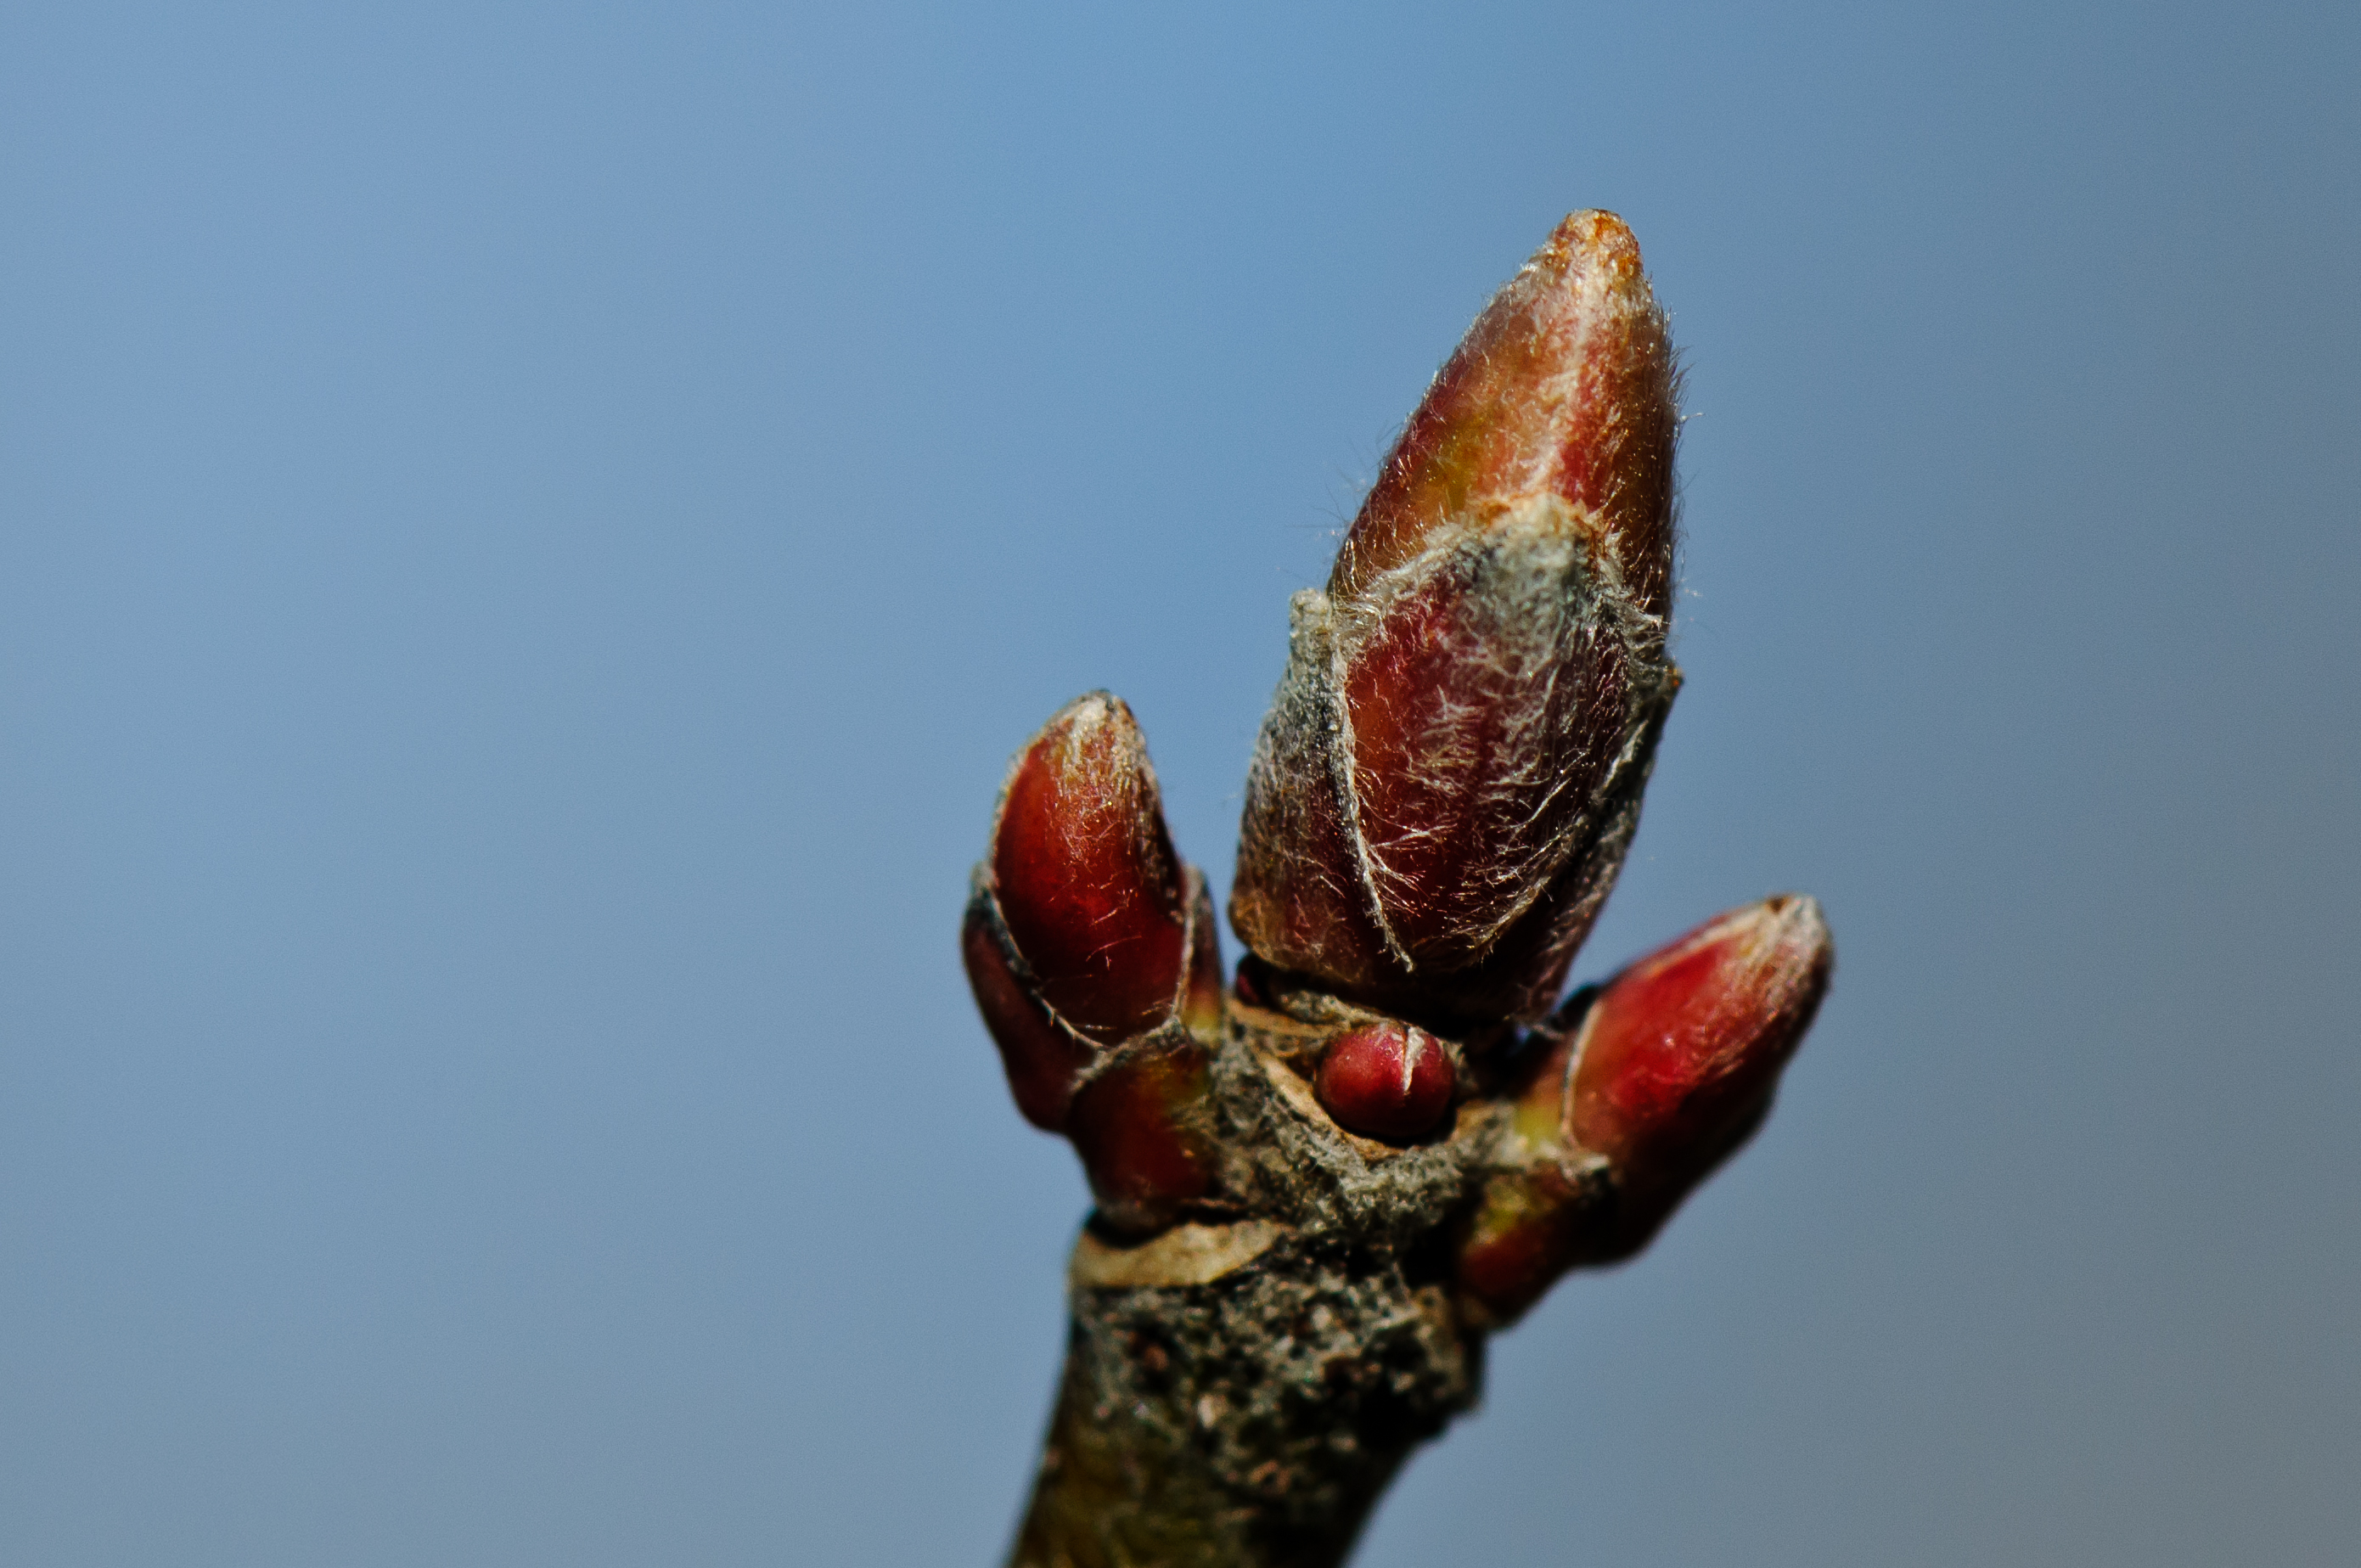
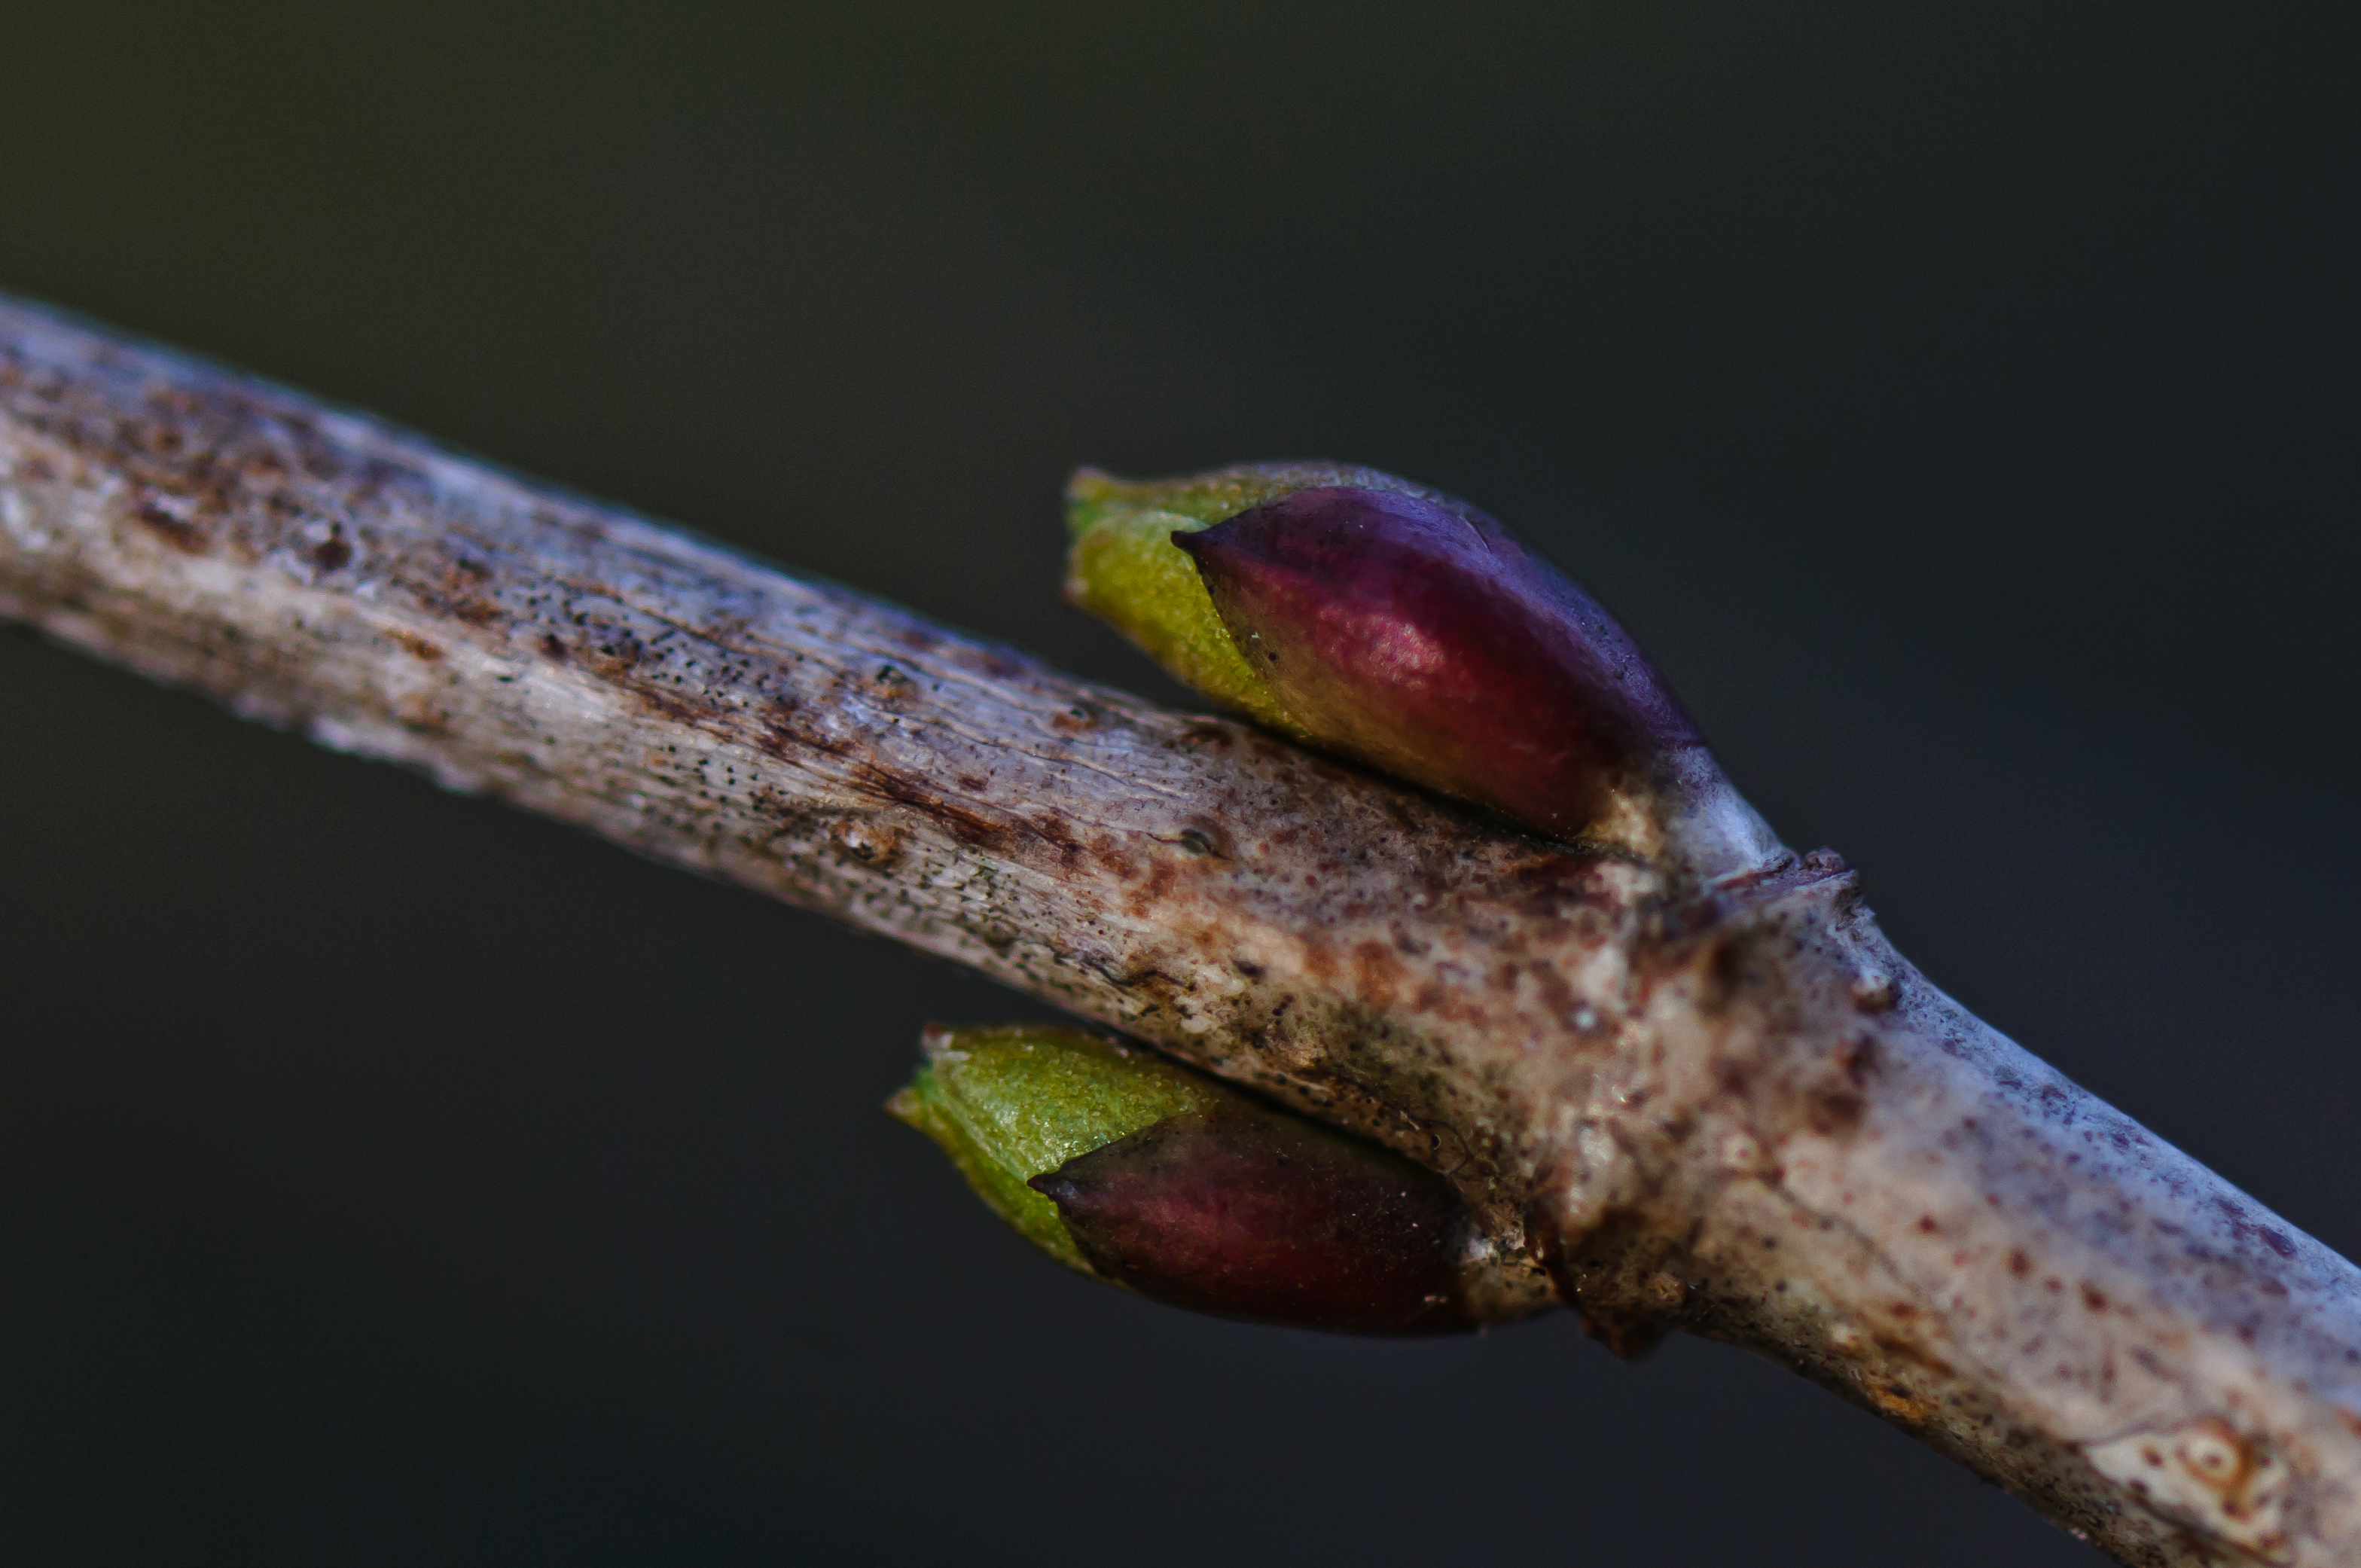
Similar cards can be created for Green-Down, exhibiting the colors of plant senescence. Documenting your plant phenology observations through photos and sketches is a great way for students to track plants’ life cycle and it creates a resource for future student observers. This can be a part of your Student Climate Research Campaign activities. You can extend this activity further by comparing your plant observations to local temperature and precipitation measurements.
Suggested activity: Start gathering your equipment and define a site for documenting Green-Up if you’re in the Northern Hemisphere. You can learn additional information about this activity on the GLOBE website. Once you begin taking photographs or drawings, share them with us on Facebook. You could also use this activity as an inspiration for your entry into the GLOBE Earth Day Video Competition, which is occurring right now.
thanks jessica