Extensions - Phenology and Climate


Phenology and Climate Project Extensions
___________________________________________________
Make your own Class Green-Up Cards
While you are monitoring your plant(s) as part of the GLOBE Phenology and Climate Project, think about taking pictures and sketching the plants' progress in a science notebook. You can turn the observations, photos, and sketches into your own Green-Up Cards. If you want to create your own Green-Up photo set there are a few details you should keep track of:
- Identify the type of plant
- Identify location of the plant (latitude and longitude, elevation if possible)
- Identify site impacts (those things that may impact green-up such as proximity to building(s) and irrigation systems)
- Take photos of the plant from the same angle, consistent distance from the plant, and same camera settings each time
- Note the date and time of your observation, and make a sketch of what the plant looks like
- Make sure you take photos through the various stages of Green-Up: Dormant, Swelling, Budburst, during Length measurements, maximum Length, and possibly Loss
To share your class' Green-Up Cards with GLOBE:
- Insert photos and any sketches into the Class Green-Up Cards form (a Microsoft Word document).
- Save the form as a PDF file. Please name the file using the following naming convention <Genus_Species_lat_lon_school>.pdf
For example,Genus Species = Acer Negundo
Latitude = 40.03509 (Northern hemisphere is positive, Southern hemisphere is negative)
Longitude = -105.24366 (Eastern hemisphere is positive, Western hemisphere is negative)
School Name = Fairview Middle School
Your filename would be: Acer_Negundo_40.03509_-105.24366_Fairview.pdf
- Upload your PDF file to the Class Green-Up Cards folder in the Phenology and Climate Project Group Documents.
For more information on developing Green-Up Cards, see the NASA Langley Research Center GLOBE Phenology website "Preparing for Green-Up".
___________________________________________________
The GLOBE Earth System Poster Learning Activity
The Earth System Poster and Learning Activities are a great way to explore the Earth as a System.
For this extension activity, explore the images by focusing on studying the relationship between Biosphere and the other environmental variables.
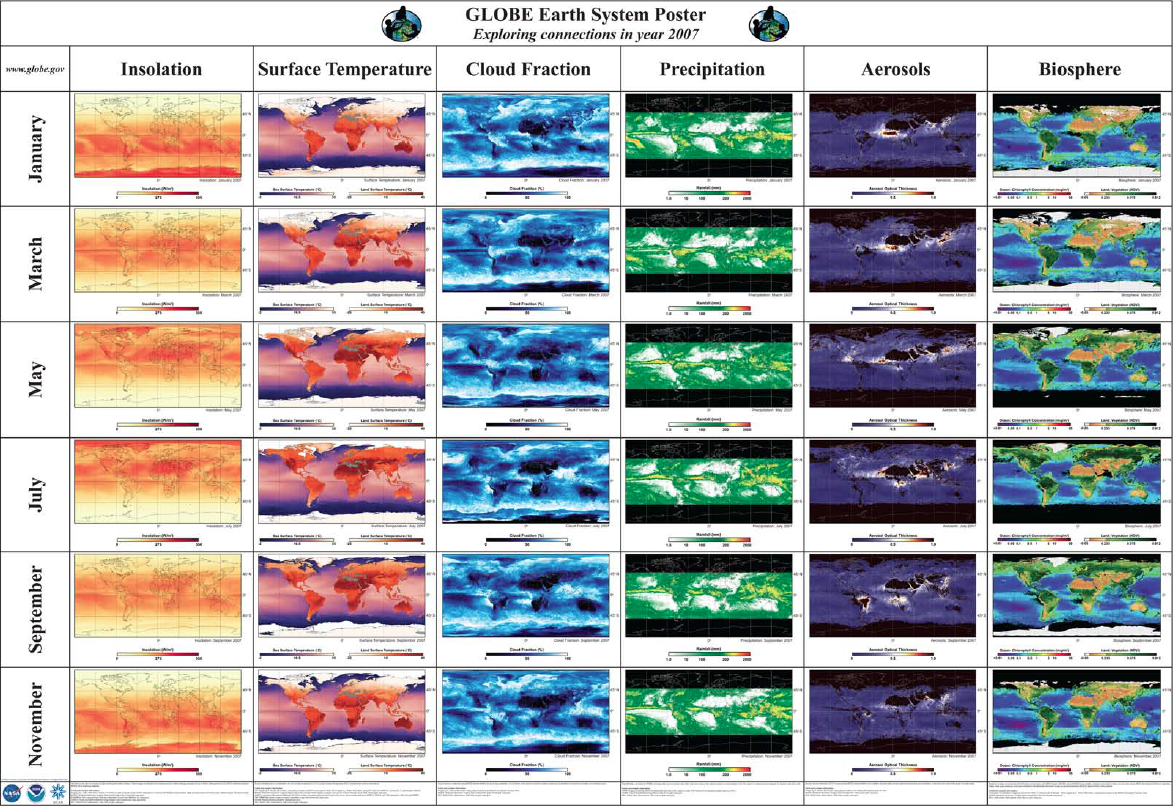
- Divide the students into two groups. Give one group of students the Biosphere images and the Surface Temperature images and give the other group the Biosphere images and the Precipitation images.
- Have students arrange the images in chronological order, so that both variables are next to each other for each month (January Biosphere next to January Surface Temperature January Precipitation, etc).
- Ask groups to identify the relationships and associations between the variables. Use the following guiding questions: What relationship do you see between Biosphere and Surface Temperature? Between Biosphere and Precipitation? How might other variables affect these relationships? [Provide images from the other variables in the poster if requested by the groups]
- After several minutes, ask students to share with the entire class the relationships they have identified between the two variables and the methods they used to identify these relationships.
You can also use the poster activity to define Normalized Difference Vegetation Index (NDVI), which is the satellite-based way to study green-up and green-down, and perhaps encourage students to consider the limits to using a satellite-based measurement for plant phenology. This concept helps to establish the importance of ground-based GLOBE phenology and atmosphere/soil measurements!