Visualize Data


Visualize Data

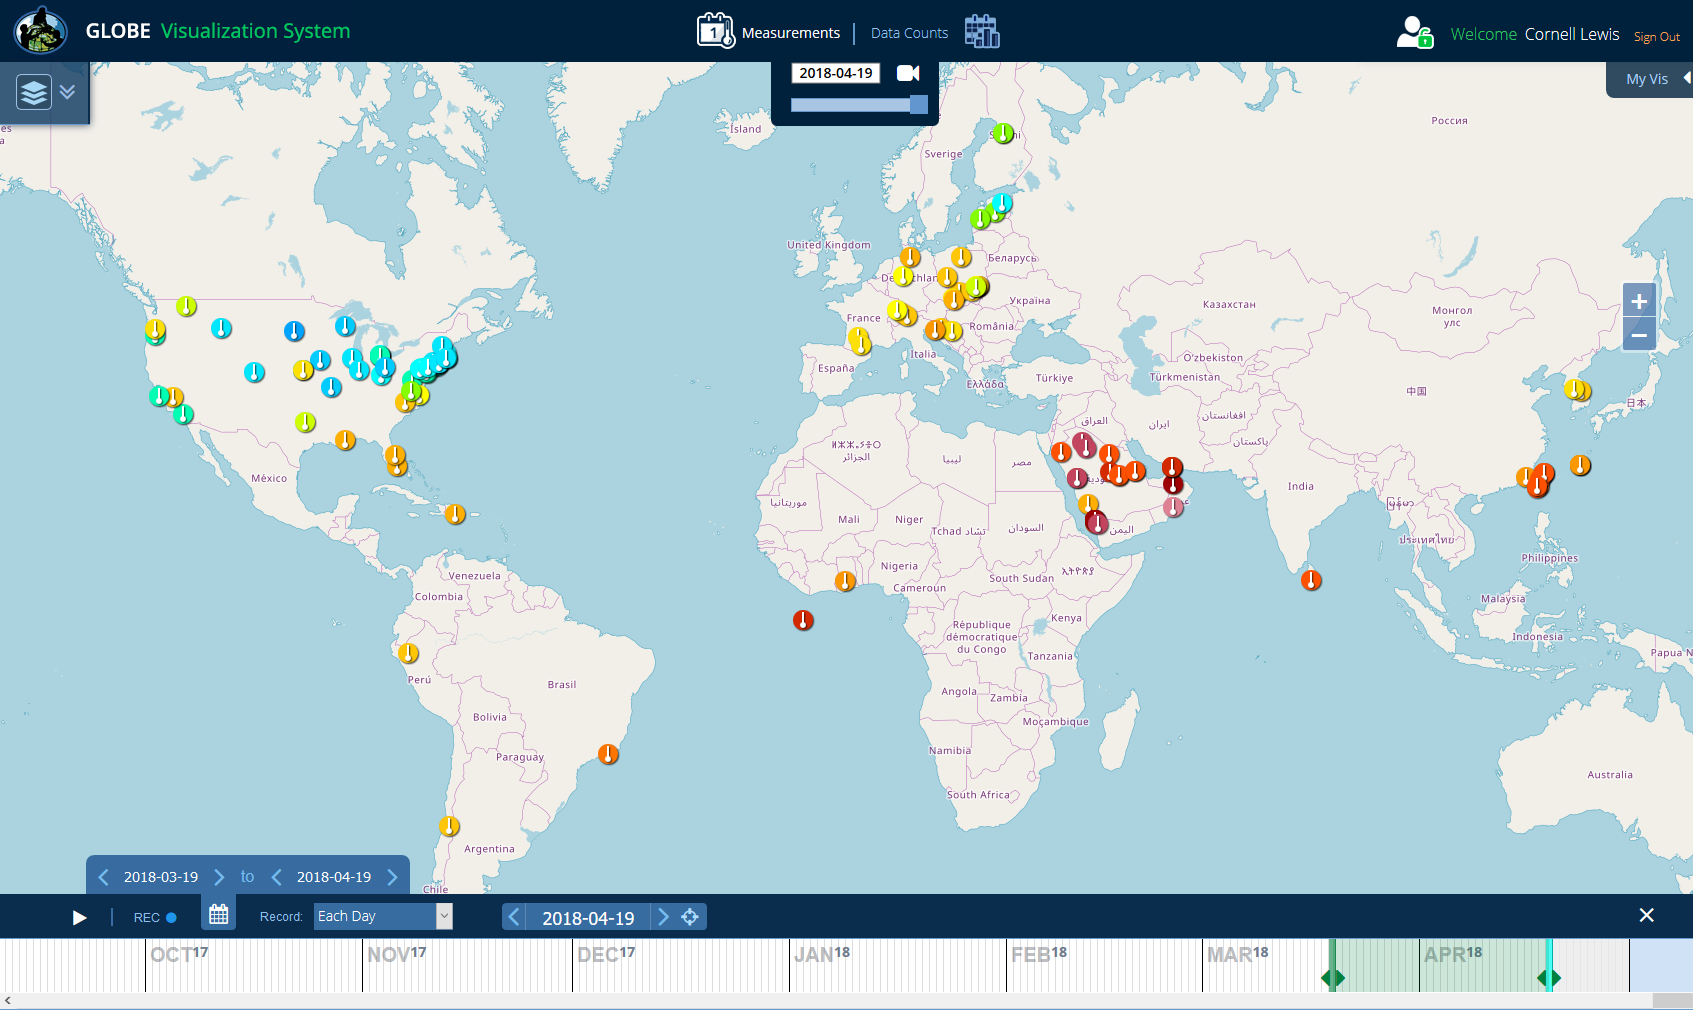
View, graph and export GLOBE data from around the world with the GLOBE Visualization System. With this system, you can use GLOBE's various filters to find both contemporary measurements and historical data ranging back to 1995. Currently, this system supports a subset of GLOBE protocols but new features are continually added so be sure to check back regularly for the latest updates.
Review the Data User Guide before downloading and using data.
How to Use the Visualization System
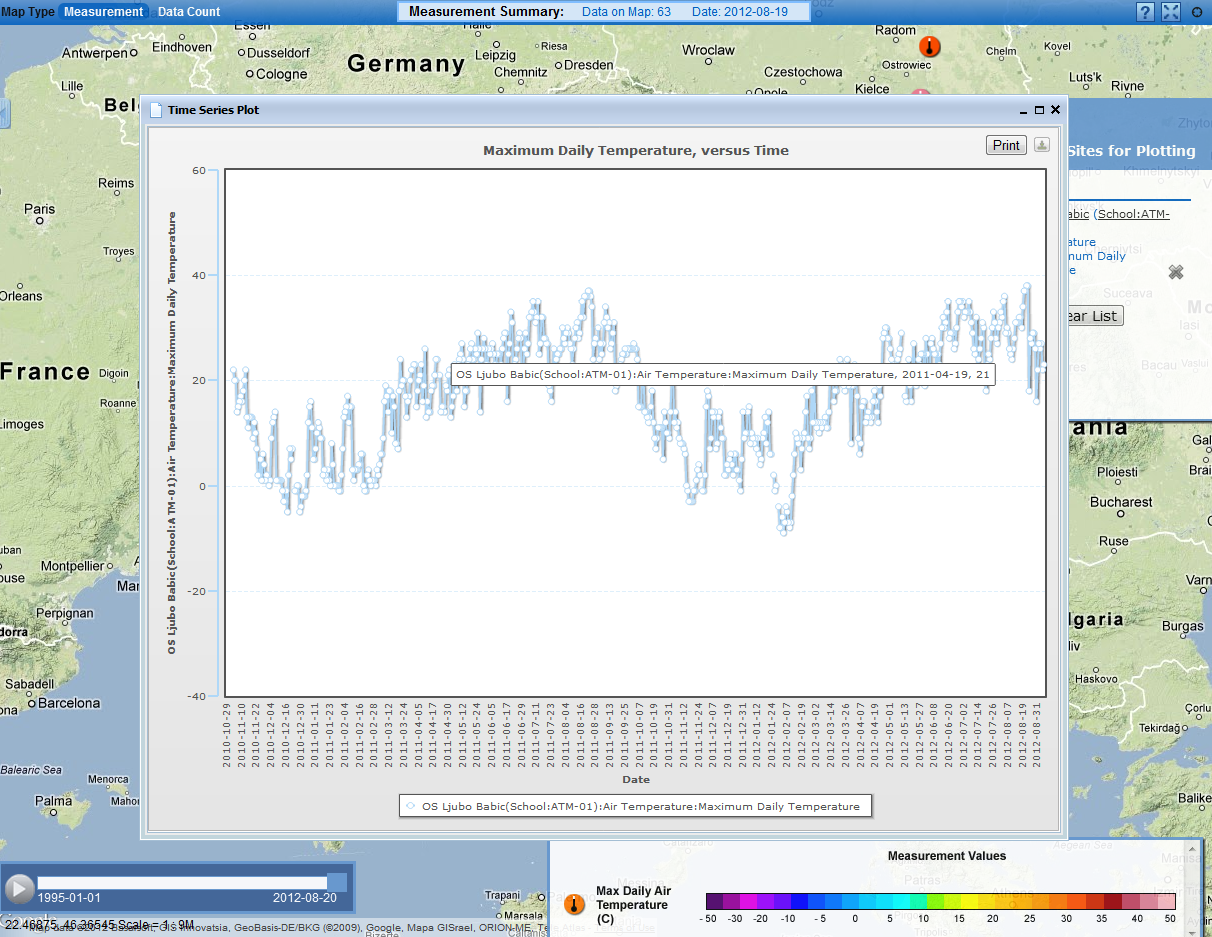
Learn how to access data, set up graphs and use the various functionalities of the visualization tool with GLOBE's comprehensive tutorial. You can download the tutorial in the following formats:
You can also construct maps and add visual layers with GLOBE data.
Learn more about setting up data maps to ArcGIS Online.
For more information on GLOBE's mapping tools, see the GLOBE Open Geospatial Consortium (OGC) Web Map Service Documentation.
Long-Term Data
The National Centers for Environmental Information manages the measurements of long-term air temperature (version 3 data set) and precipitation (version 2 data set) from the Global Historical Climatology Network. You can download these data sets as a Google Earth .kml file that displays the stations recording both these protocols.
For more information about these data sets, visit the Global Historical Climatology Network Monthly homepage.
Learn how to use Google Earth with .kml files to locate long-term data records.
Find Data for a Specific City
Download and view long-term air temperature and precipitation data records for specific cities in Google Earth. You can also download a city's measurements in a .csv file.
To find measurements for a specific city:
- On a device, open Google Earth.
- Select "Projects," and then "Open."
- Select either "Import kml File from Computer" or "Import kml File from Google Drive."
- Select the file to view.
- Select "Open."
- After the file is loaded, select the city that has the measurements.
City measurements are available in either a monthly or yearly format, so be sure to view data for the correct time interval being measured. Yearly averages should be performed on monthly data, while regional averages can be conducted on either monthly or yearly intervals.
Learn more about viewing long-term air temperature and precipitation data sets.