How to Compare My Cloud Observations with Satellite Data - Clouds Protocol


How to Compare My Cloud Observations with Satellite Data
How can I tell if my observations are correct?
We encourage you to look and compare your observations to satellite data. You may still ask yourself if it was correct. Note how much of your report is about the same as the satellite data on the match table. Here are some suggested comparisons:
Does your total cloud cover match the satellite report?
The first section on the satellite match table contains the
following details about the observation made by one or more satellites
and by you: date & time the observation was made,
latitude/longitude, and total cloud cover. Look across to compare the
satellite data with your observation. See if the cloud cover percent
reported by the satellite(s) is within the range you selected in your observations.

What if the observations don’t
agree: Cloud cover discrepancies can be due to various
things. Maybe the satellite saw clouds at different layers you were
not able to detect with your eyes. Maybe it was hard for you to choose
the right range of cloud cover. We recommend practicing with a fun
activity “Make a Simple Cloud Cover Model”, you can test
your skills with cloud covers created by others!
Take it a step
further:You can calculate the difference between the
satellite cloud cover percentage and your report. If the satellite
percentage is higher than yours, then see how far off it is from the
highest number in the range you selected. You can do something
similar, but with the lowest number in the range you selected, if the
satellite percentage is lower than yours.
Did the satellite report clouds at the same levels (low, mid,
high) as me?
Look straight across the match table, and see if there are
satellite observations for the same altitude (HIGH, MID, and/or LOW)
that you observed. If you see satellite information (cloud altitude,
cloud phase, cloud opacity, and cloud cover) for the same altitude you
reported, then you AND the satellite agree that there were clouds at
that level!

Take it a step further: You can now compare if your observations and the satellite data agree in the opacity and cloud cover for that level.
What if the observations don’t agree: Our view from the bottom up to space gives us the advantage to see the bottom of clouds. It can limit our ability to see clouds at higher levels, especially if the lower level clouds are very thick and cover almost the entire skies. Satellites, which can see the higher clouds, can note if there were clouds higher than those you reported. Does this mean your observations are wrong? Not at all! It is a great time to see if the satellite was able to detect clouds at different heights. Sometimes this is not easy for satellites to do; read Satellites can only see the top of clouds under the portion “How can my observations help researchers?” in the section below for more information.
How can my observations help researchers?
Researchers are interested in your viewpoint of cloud observations compared to satellite data for various reasons. Remember, satellites do not report cloud types, but do report cloud altitude, cloud cover, cloud opacity, and cloud phase.
1. Satellites can only see the top of clouds
Some instruments on satellites may not be able to detect cloud layers that are below a cloud layer higher above.
What to look for: On your Satellite Match Table, look for instances when you observed and reported low- and/or mid-level clouds, and the satellite data reported is for cloud layers above your report.

2. Clouds that are transparent are hard for satellites to detect
Not all clouds are created equal, and that includes how they interact with energy. Do all clouds cast shadows? No, each cloud type interacts differently with the energy coming from the Sun. Opacity, or how the cloud looks, gives us an idea of how they are interacting with the Sun's light.
What to look for: On your Satellite Match Table, look for instances when you observed transparent cirrus clouds and see if the satellite was able to detect them. These types of cirrus are called sub-visible cirrus. Some instruments are able to detect them, others cannot.
![]()
3. Presence of Contrails or clouds produced by airplanes
Contrails are very thin clouds and can be hard to detect by satellites. Your observations are the best method to keep track of the number of contrails around the world.
What to look for: On your Satellite Match Table, look for instances when you observed contrails. Note if the satellite reported back high-level clouds. If it did, then you can look for the image found at the bottom of the page and see if you can notice the contrails on the image. Use the “How to read a satellite match” to find the satellite images on your satellite match table. Use the help pages below on how to read satellite data made for each satellite that you can possibly match to with your observations. If the satellite did not report any high-level clouds, then you know that it was not able to detect them.
4. Clouds present when there is snow or ice on the ground
Not everything that is white a cloud, especially from a satellite’s top-down view. Read the Earth Observatory for Kids newsletter titled Clouds or snow? A Satellite Mystery. See GOES 16 images of the Winter Weather Bomb in January 2018 and see if you can note where the clouds are and where is the snow!
What to look for: On your Satellite Match Table, look for instances when you chose “yes” for snow/ice in your surface conditions report, underneath the match table and reported clouds.

Use the following to learn how to interpret satellite data on
your match table.
- GEO
(Geostationary Earth Observing) Satellites
- Interpret
MODIS Rapid Response and Worldview images.
How to Read a CALIPSO Satellite Match
About CALIPSO
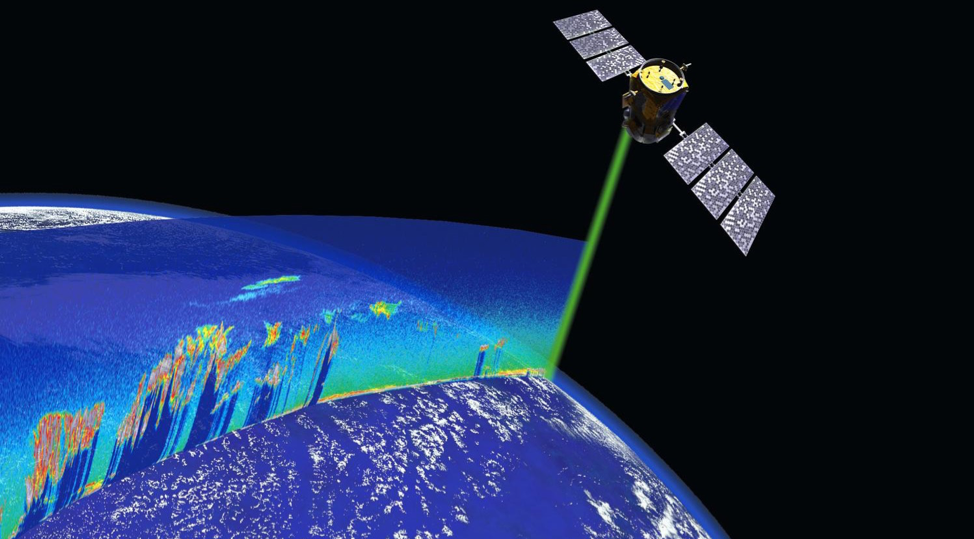
CALIPSO, or Cloud- Aerosol Lidar and Infrared Pathfinder Satellite Observations, is a mission aimed to help better understand aerosols and clouds. CALIPSO uses LIDAR or Light Detection and Ranging to create vertical profiles of clouds and aerosols by sending pulses of light to Earth’s surface and assessing the amount of light that is reflected back. The information obtained from CALIPSO helps us understand clouds, aerosols, and radiation in relation to climate and weather to ultimately make this world a healthier, better place to live in.
CALIPSO data is collected in orbits, or the path the laser took to
collect atmospheric 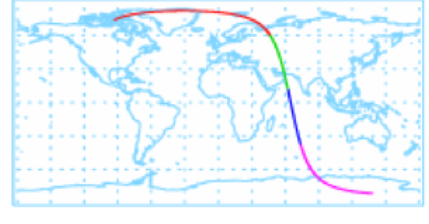 information. The orbits are then divided into smaller
chunks. When you receive a satellite match with CALIPSO, you get an
image for the orbit portion that passed over your latitude and
longitude. See example below of an orbit. The four different colors
are the four portions or smaller chunks the data is divided into. The
example used in this document was taken within the green portion of
the orbit.
information. The orbits are then divided into smaller
chunks. When you receive a satellite match with CALIPSO, you get an
image for the orbit portion that passed over your latitude and
longitude. See example below of an orbit. The four different colors
are the four portions or smaller chunks the data is divided into. The
example used in this document was taken within the green portion of
the orbit.
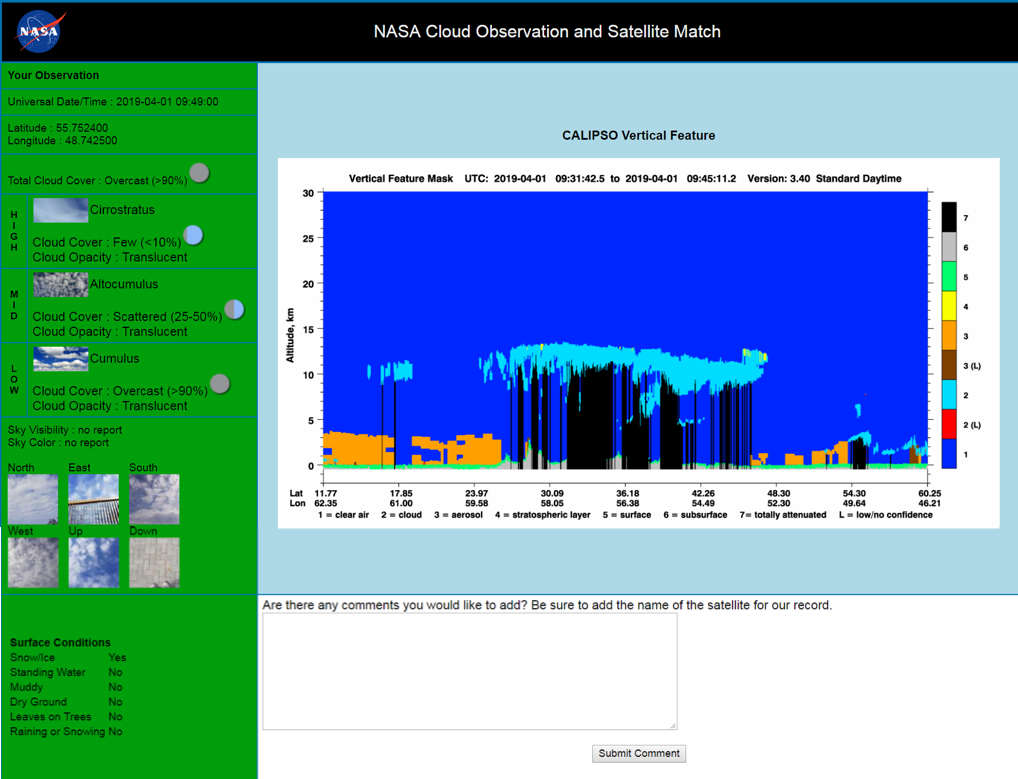
CALIPSO and Satellite Matches
Below is an example of a match table with CALIPSO data. The left-hand side in green are your observations, including any pictures submitted and surface conditions. The right-hand side is the CALIPSO Vertical Feature that matches your location and time.
The vertical feature mask shows the different classifications of things detected in the atmosphere for that day, time, and location. Let’s see how to read the information.
How to Read the CALIPSO Vertical Feature Mask
The vertical feature mask shows the different classifications of things detected in the atmosphere for that day, time, and location. Let’s see how to read the information. The vertical feature mask has a lot of information, so let’s break it down into parts.
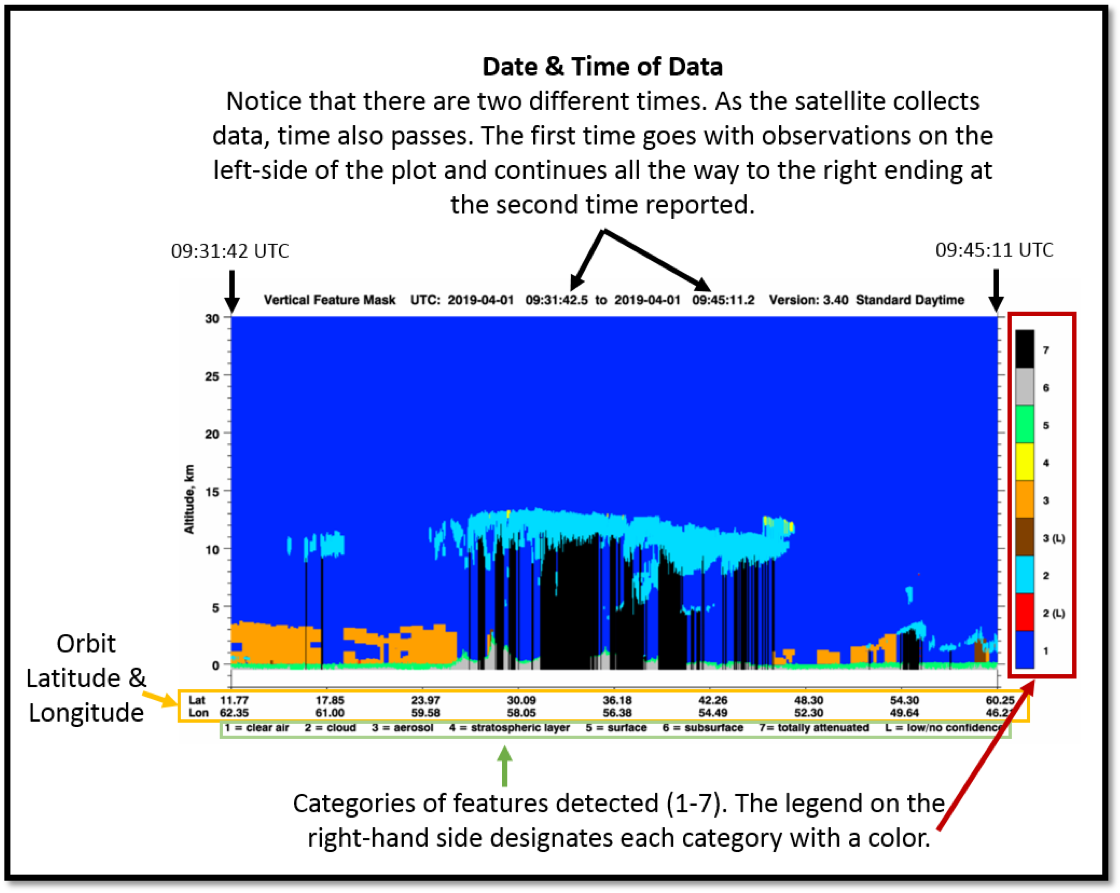
Follow these steps to find out what CALIPSO detected when you made your cloud observations:
Step 1 – Find your latitude and longitude
Below the plot, you will see “Lat Lon”, which refer to latitude and longitude values, displayed one on top of the other (see yellow-orange box). Remember, your latitude and longitude are on the satellite match table, on the green column. Look through the latitude and longitude values on the CALIPSO plot and make a mark on where your location is as best as possible.
Step 2 – Identify Features Detected
The different colors on the plot show the different features (clouds, aerosols, clear air, etc) detected in the atmosphere. Use the color bar on the right-hand side (red box) to find the category of the feature that was detected near your latitude and longitude. Then find what the feature is by looking at the numbers found at the very bottom, underneath the latitude and longitude values (green box).
Step 3 – Compare
Now that you found the features, see if you were able to see the same thing. Also, see the altitude of the feature. The y-axis in altitude in kilometers. Also note how thick or thin the feature is by using the altitude axis.
Altitude range of satellite observation (km) | GLOBE cloud type |
Above 6 | High clouds (contrails, cirrus, cirrocumulus, or cirrostratus) |
2-6 | Mid level clouds (altostratus or altocumulus) |
0-2 | Low clouds (fog/stratus, stratocumulus, cumulus, nimbostratus, or cumulonimbus) |