MODIS - Clouds Protocol


How to Interpret NOAA-20 Satellite Data
Where do I find my satellite image?
You can find the satellite image on your satellite match table, the link(s) sent to you in your personalized email from NASA. In the center of the table, you will find the satellite data. Look to see if your observations matched to NOAA-20. Follow the column down and you will see a small image with the word “Worldview” above it.
The team at NASA Langley Research Center will send you a true-color visible image of VIIRS for every matching observation you send us. What is a true-color image? VIIRS observations of visible light are combined to create an image of the Earth that approximates color as seen by the human eye. You will see the world as if you were riding the satellite, looking at Earth with your own eyes.
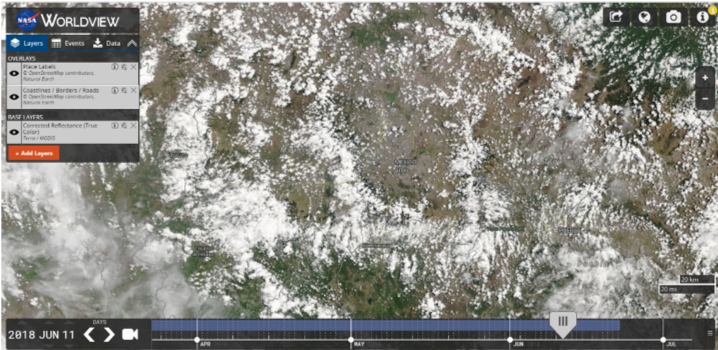
Worldview – Is a visualization tool that allows you to browse satellite images centered on the spot of your observation. With Worldview, you can see easily play with the satellite data in various ways:
a. Layers, Events, Data – You can find these options
on the top left of your screen. We select for you the MODIS or VIIRS
data in the visible, so you see what you would be able to see with
your own eyes if you were on the satellite. We also selected labels
and borders to help you see where you are looking at in the world.
b. Timeline on bottom of screen – This time lines
shows the date and time of your observation. You can scroll back and
forth and see how the clouds change with time. You can also create a movie.
c. Icons on top-right of screen – These icons let you
share, change the projection of your view, take a picture, and zoom in
and out.
What do the different colors mean?The worldview image is true color like the rapid response image, but further processed to remove artifacts and the “fisheye lens” effect.
What can I do with my satellite image?
We invite you to study your image and compare it with your cloud observations. Here are some ways we suggest:
-
Cloud Types
Look at the satellite image and try to identify the cloud types observed. You can then tell what cloud types the satellite captured in the image.
Tip: Remember how clouds are named? The three basic names – cumulus, stratus, cirrus – are based on how these cloud types look (puffy, long and thick, wispy, respectively).
Take it a step further: Look at the satellite match table to see what altitude (low, mid, high) the satellite identified for these clouds. Then, you can have a really good guess at the cloud type in the image.
-
Cloud Structures, Systems, and Other
Look to see if you notice any big structures or storms in your area or approaching you area. Remember cloud types give you an idea of the weather that is approaching your area.
Tip: It might be useful to zoom a lot to get a sense of what is happening in a big scale. You will be able to then see the structures and identify any storms that may be in the image.
Take it a step further: Find the weather report for that day using your favorite website and see if you can tell what is happening based on the cloud structures.
Other in this portion can be dust, or smoke plumes, for example, that can be observed in the image.
-
Estimate Total Cloud Cover
Zoom into your area using Worldview and estimate the total amount of cloud cover. How does your estimate compare to your observations? How does it compare to the satellite’s report?
Tip: Remember that your view from the ground up is not as extensive as the satellite’s view from space looking down at Earth. Have you ever made an observation where the cloud cover changed just a few minutes before or after your observation? If so, can you connect that with large cloud structures in your satellite image?
Take it a step further: Estimate the amount of coverage per cloud type you were able to identify in the image.
-
Calculate Total Cloud Cover
The team at NASA Langley Research Center matches your observations to satellite data by looking at up from your spot in every cardinal direction. Save the image using the icons on the top right, then use Worldview’s scale on the bottom right, to draw a box XX km in every cardinal direction (north, south, east, west). Once you have your box, calculate total cloud cover in that box. How does your result compare to the reported total cloud cover observations on the satellite match table?
Tip: Use grids printed on transparency sheets to get a more precise calculation of total cloud cover. You can use the sheets on top of the printed image or by taping the sheets onto the computer monitor.
Take it a step further: Calculate the percent difference between the estimated total cloud cover and the calculated total cloud cover.
-
Adding Layers (Other Observations)
Using Worldview, look on the options on the left-hand side and find a red-orange box that has ‘+ Add Layers’ and click on it. Go to ‘Hazards and Disasters’ and choose a topic (Air Quality, Ash Plumes, Drought, Dust Storms, Fires, Floods, Sever Storms, Shipping, Smoke Plumes, Vegetation, Other). Within each topic there are different measurements that you can overlay on your image.
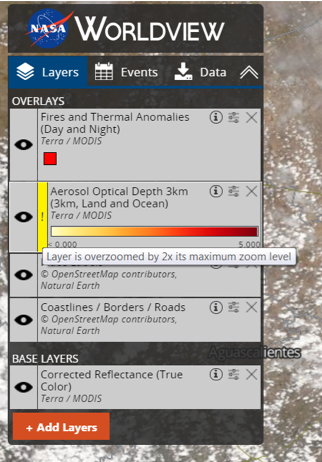
Tip: Some options might only be available for a certain date range. Also, some values do not work well if the image is zoomed in too much. You will note a yellow exclamation point next to the name of the layer on the top-right navigation.
Take it a step further: Overlay different layers to see how different spheres of the Earth interact with each other.
What is VIIRS?
VIIRS (Visible Infrared Imaging Radiometer Suite) is an instrument aboard the NOAA-20 satellite. It collects visible and infrared images and global observations of the land, atmosphere, cryosphere and oceans. It features daily imaging capabilities across multiple electromagnetic spectrum bands to collect high-resolution atmospheric imagery and other instrument products, including visible and infrared images of hurricanes and detection of fires, smoke and particles in the atmosphere, such as dust. For each observation you make that matches in time and location with the NOAA-20 satellite, you will receive a VIIRS true-color image showing the conditions around you when you took the observation.
Here is additional information on how to read satellite data. Take a tour of
Worldview by clicking on the ![]() icon on the top right. Review detailed information about Worldview.
icon on the top right. Review detailed information about Worldview.