About Satellite Comparison Table - Clouds Protocol


About the satellite comparison
The "GLOBE Cloud Observation and NASA's Satellite Comparison" web page contains some detailed satellite information. Here is some commentary to help you interpret that information.
Altitude (km)
This is the altitude where the satellite thinks the cloud is located. Remember that we are using a passive satellite remote sensing technique, so there is limited information to use to determine a cloud's height. For comparison to the ground observation we use the following (somewhat arbitrary) set of altitude cut-offs:
| Altitude range | Cloud level |
|---|---|
| above 6 km | High |
| 2-6 km | Mid |
| 0-2 km | Low |
One possible result of this set of cut-offs is that a single layer of clouds, say an extensive nimbostratus (rain) cloud, can be split by the satellite into two levels, because parts of the cloud top may extend above the arbitrary 2 km cut-off.
Opacity
The
satellite measures Opacity in terms of Optical Depth. This is a non-dimensional
quantity that contains information about how much of the Sun's light
is able to penetrate the cloud. To compare to the ground observation
we use the following (very arbitrary) set of cut-offs: 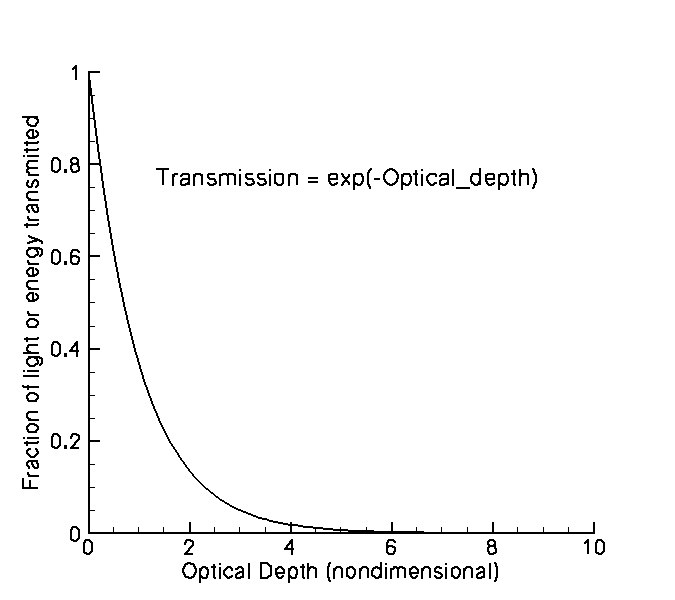
| Optical Depth Range | Opacity Category |
|---|---|
| above 10 | Opaque |
| 3-10 | Translucent |
| Transparent | Transparent |
With the presence of any clouds, the ability for Sunlight to reach the Earth’s surface decreases dramatically. For example, even at low optical thicknesses recorded by the satellite (but greater than zero) less than 5% of the Sun’s light is getting through the cloud. At a high optical thickness, the light coming through is truly a tiny fraction. The graph to the right shows this concept in relation to optical depth range.
However, the human eye has a logarithmic sensitivity to light levels, so deciding on the right cut-offs numbers to organize the satellite data into the ground opacity bins is a challenge. Furthermore, the report of the Visual Opacity by a ground observer is a subjective process. If you are interested, you may want to analyze the correspondence between your reports and the satellite opacity, and let us know if you find a cut-off or a specific range of data that routinely falls into a specific ground opacity category.
Cloud Cover
The same categories are used for both the ground and satellite reports. The thing to realize here, though, is that the satellite, using a nice two dimensional (flat) view of the sky from above, can calculate a quite precise cloud fraction. The ground observer has to estimate the cloud cover from their single point of view on the ground, and is providing a subjective estimate of cloud fraction not a measurement. With the optical effects that come from looking at the sides of clouds and through varying layers of the atmosphere, that can be quite a challenge.
Cloud Phase and Temp(K)
The satellite cannot tell the difference between a cirrus cloud and a cirrostratus cloud (cloud type), but it can get at least some information about the particles that make up the cloud: ice crystals vs water droplets. This is called the cloud phase - meaning the phase (ice, liquid, or mixture of both) in which the cloud material exists. Thus, the cloud phase can provide another clue to compare with the cloud type reported on the ground, low clouds tend to be warmer or made of water droplets, while high clouds tend to be cooler and made of ice crystals. The cloud phase information is partly based on the temperature of the cloud. For a remote sensing instrument, the cloud temperature is not always accurate for thin clouds, because heat energy from a lower level cloud or the ground can contaminate the signal. The temperature values here are given in degrees Kelvin.
| Temp (K) | Temp (C) | Temp (F) |
|---|---|---|
| 273.15 | 0. | 32. |
| 233.15 | -40. | -40. |
Note that in the atmosphere, liquid water can exist below 0 degrees Celsius, the normal freezing point of water, unless something happens to start the process of forming ice crystals. However, below -40 degrees Celsius, a process called homogeneous nucleation occurs, and water will spontaneously freeze.

Things to look for
Effect of snow on the ground
If you live in an area that sometimes has snow-covered ground,
one thing to look for when using the satellite information is the
possibility that the satellite is mis-interpreting the presence of
snow cover as a cloud. In the Altitude column, look for a very low
cloud altitude (If you have mountains nearby, you may want to
calculate the height of the mountains in km to compare). Also look for
a cloud temperature at or around freezing. These are possible
indicators of this problem. The image at right shows an example of
what a passive satellite remote sensor can see in a region with both
snow and cloud present. While broad areas of cloud and snow can be
distinguished, at the detail level, it is hard to tell the difference.
Satellite Matching Method
To match a ground observation to satellite data the NASA Cloud team defines an area around the observation location (40km radius), which we call a footprint. This helps identify the portion of the sky above your location that we will retrieve satellite data form, pulling from a larger data set to generate a small subset of data. Any satellite data touching your footprint is averaged to provide the best match opportunity and more appropriately reflect the sky conditions.