

Advancing Earth System Science


Advancing Earth System Science
The GLOBE Program’s primary goal is to advance Earth system science and its applications. GLOBE has provided valuable data to NASA and the Earth science community for three decades. Projects in this section highlight the use of the GLOBE Program’s protocols and data by the scientific community to better understand and address environmental problems including changes in river ice formation and modeling soil dynamics.
We also highlight some ongoing research efforts by scientists using GLOBE to:
- Explore land use impacts on wildlife
- Improve forecasting of mosquito-borne risks
- Gather ground validation data in the tropics and Global South to improve a biomass product from Global Ecosystem Dynamics Investigation onboard the International Space Station,
- Monitor Tabebuia, a flowering plant from space!
Projects
Authors: Brown et al., 2023
DOI: https://doi.org/10.1080/15230430.2023.2241279
Brown et al., explored long term changes in river ice formation in southcentral Alaska. For rural Alaskan communities, rivers serve as important transportation routes and provide communities with access to hunting grounds, fishing, harvesting, and access to other communities etc. Impacts from climate change are making these river crossings more vulnerable to rapidly changing ice conditions.

Study area map showing Copper River Basin in southcentral Alaska.
Figure reproduced from Brown, D. R. N., Arp, C. D., Brinkman, T. J., Cellarius, B. A., Engram, M., Miller, M. E., & Spellman, K. V. (2023). Long-term change and geospatial patterns of river ice cover and navigability in Southcentral Alaska detected with remote sensing. Arctic, Antarctic, and Alpine Research, 55(1). https://doi.org/10.1080/15230430.2023.2241279
The Copper River serves as an ideal case study to explore problematic trends in river ice characteristics that have significant impacts on local communities. Most inhabitants live on the western side of the river with traditional harvest lands on the eastern side of the river requiring travel across the river. With early spring break-up, mid-winter breakup leading to thinner ice and persistent open water, Alaska native people (Ahtna people – a northern Dene Athabaskan group) are seeing drastic changes in their way of life, which includes reduced access, safety concerns, fatalities, and changing access conditions to hunting areas.
Understanding historical changes in river ice cover
Researchers used the historical archive of multispectral Landsat imagery for a retrospective analysis of river ice from 1973-2021. This data was compared with citizen science observations submitted through the GLOBE Observer app and the Fresh Eyes on Ice website. Photos from April 2021-May 2022 were used to understand what ice conditions can be inferred from visual interpretation of the satellite imagery. These photos also help document local river use under different ice conditions.
452 observations from Landsat archive images were examined, with long time gaps in available images between 1986 to 1995 with almost no winter observations, which make it difficult to quantify what changes in ice were observed during this timeframe. This study also combined citizen science observations which provided ground truth observations of ice conditions such as ice thickness and freeze-up or break-up timing.
Researchers focused on examining the relative proportions and probability of high ice content and the frequency of incomplete freeze-up. They examined interannual variations in weekly ice extent to identify years without development of complete ice cover.
Using Sentinel-2 imagery the researchers assessed river reaches that were likely to develop a potentially navigable ice cover versus open water. Flow energy as a potential control over later-winter open water areas was also examined. Proposed that high energy would slow development of surface ice cover.
Using Sentinel-1 SAR (Synthetic Aperture Radiation) the study looks at seasonal development of ice and open water occurrence. SAR provides a benefit in not being affected by low light conditions or cloud cover and is effective to explore these differing ice conditions regardless of the weather conditions.
Results

Figure 2 shows ice extent for sections of the Copper River, with collocated time lapsed camera and citizen science photo.
Figure reproduced from Brown, D. R. N., Arp, C. D., Brinkman, T. J., Cellarius, B. A., Engram, M., Miller, M. E., & Spellman, K. V. (2023). Long-term change and geospatial patterns of river ice cover and navigability in Southcentral Alaska detected with remote sensing. Arctic, Antarctic, and Alpine Research, 55(1). https://doi.org/10.1080/15230430.2023.2241279
The research found substantial variation was observed in the timing, duration and presence of high ice extents. This was complemented with firsthand knowledge of local residents. Logistic regression of changes over time showed significant declines in probability of high ice extents throughout late winter.
Formation of ice cover conductive to travel has shifted to later in the winter. Nonexistent periods of widespread ice cover limits the ability of residents to cross the river near their communities.
Although difficult to compare results across different areas, the quantitative and qualitative changes in ice cover on the Copper River appear to be particularly pronounced. Much of the patterns observed are impacted by patterns in stream flow energy and river morphology. Open water areas typically formed downstream of large tributaries (fast moving and mixing water inhibit ice formation)
Conclusion
Remote sensing approaches used to identify trends in freeze-up and open water occurrence are useful for local communities. The methodology employed can be applied elsewhere to support local decision making.
Significance of GLOBE data
Images from the GLOBE observer app and the ‘Fresh Eyes on Ice Project’ provided a comparison with concurrent Landsat satellite imagery. Photos from April 2021-May 2022 were used to understand what ice conditions could be inferred from visually interpreting satellite images. Researchers noted that notes taken by citizen scientists helped to clarify the local river use with differing ice conditions.
Brown, D. R. N., Arp, C. D., Brinkman, T. J., Cellarius, B. A., Engram, M., Miller, M. E., & Spellman, K. V. (2023). Long-term change and geospatial patterns of river ice cover and navigability in Southcentral Alaska detected with remote sensing. Arctic, Antarctic, and Alpine Research, 55(1). https://doi.org/10.1080/15230430.2023.2241279
Authors: Melkonian et al., 2007
DOI: https://doi.org/10.1016/j.jhydrol.2006.08.008
Summary
The objective of this study was to determine if the runoff and drainage output from a Soil-Vegetation-Atmosphere-Transport (SVAT) model requiring few inputs is a good predictor of changes in stream flow in a watershed. GLOBE parameters served as the primary inputs which were collected by 6 schools along the eastern coast of the USA. This comparison is a crucial step in validating the accuracy and reliability of the model.
The SVAT model is designed to simulate the dynamic exchange of energy and water between soil, vegetation, and the atmosphere. The model tracks a wide range of parameters such as evapotranspiration, drainage, infiltration of water into the soil, precipitation interactions with vegetation, and runoff generation.
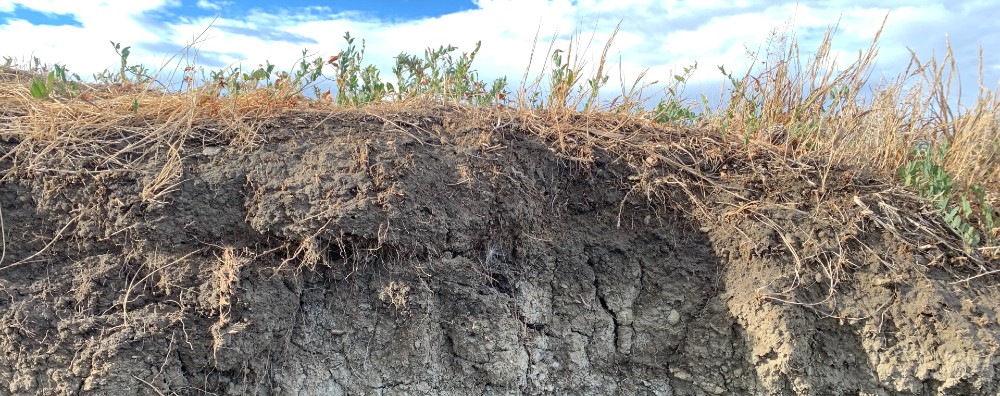
Large precipitation events can trigger significant chemical mobility (e.g., nitrogen) and understanding when these events will take place is important in the context of runoff and best management practices for agriculture. Soil-vegetation-atmosphere-transport (SVAT) models can be applied to watersheds if there is a good relationship between runoff/drainage predicated by SVAT models with changes in stream flow.
GLOBE data collected by the schools included soil moisture, precipitation, land cover, soil properties and vegetation characteristics. GLOBE weather and phenology data were used to calculate several of the parameters which included PET (potential evapotranspiration), PT (potential transpiration) and PEvap (potential evaporation). Where data gaps existed, they were complemented with weather data from NOAA or from phenology data from the nearest school.
Model Description
Simulation of soil, plant and atmospheric processes can be selected independent of each other. In this study the major processes selected were:
Potential evapotranspiration using the Linacre method.
- Method selected based on GLOBE parameters available. PET estimates from mean daily air temp, mean daily dew point temp (daily min air temp as estimate), elevation and latitude.
- Simulate PET was partitioned into potential soil evaporation and potential transpiration.
Plant water uptake
- Derived from root zone depth, number of soil horizons with the root zone, individual horizon depths, root fraction in each horizon, and soil texture by horizon.
Soil water flow (using a tipping bucket approach) and runoff using curve number approach
Run on a daily time step
Comparisons
- Normalized monthly simulated runoff and drainage was compared with normalized stream flow over one year. 37-76% of the variability in monthly streamflow could be explained by the linear relationship in monthly runoff and drainage after they were normalized to the largest monthly value over the one-year period.
- Daily runoff and stream flow after large precipitation events increased within 1-2 days following the precipitation event when average soil water content of the root zone was at or above average field capacity.
Findings:
By identifying and understanding any discrepancies between measured and simulated values, scientists gain a deeper understanding of the complex hydrological processes. The model showed promising results for 3 of the 6 watersheds but less promising in the remaining 3.
The results indicated the SVAT model could explain a significant portion of the variability in streamflow, with R-squared values ranging from 0.37 to 0.76. This Coefficient of Determination (denoted as r2 and pronounced R squared) measures the proportion of variance that can be explained by the independent variable(s) in a regression model. It shows how well the data fits the model. r2 values range from 0-1, with higher values indicating that the model explains more of the variation in the data.
The study found that the simulated runoff and streamflow were strongly influenced by soil moisture content. When soil moisture was at or near saturation, large precipitation events lead to increased runoff and streamflow with a lag time of several days. When soil moisture was low, large precipitation events did not significantly increase runoff or streamflow.
Conclusion:
This data may be useful in informing land managers about optimal fertilizer nitrogen application. GLOBE school data is readily available with large geographical coverage.
Jeffrey Melkonian, Susan J. Riha, Jessica Robin, Elissa Levine, Comparisons of measured stream flow with drainage and runoff simulated by a soil-vegetation-atmosphere transport model parameterized with GLOBE student data, Journal of Hydrology, Volume 333, Issues 2–4, 2007, Pages 214-225, ISSN 0022-1694, https://doi.org/10.1016/j.jhydrol.2006.08.008. (https://www.sciencedirect.com/science/article/pii/S0022169406004240)
Dr. Yang is evaluating long-term impacts of land use transformation on fire regimes, which is funded through NASA’s Early Career Investigator Program in Earth Science.
Escalating wildlife risks have emerged as a major global change challenge with profound ecological and social consequences. Significant uncertainty exists regarding the relative influence of climate change compared with land use changes in altering historical fire regimes. By combining the three disparate data sources, this project will reconstruct a 60-year trajectory of land use and fire regime changes to empirically isolate human and climate impacts on shifting fire regimes. Outcomes will also inform integrated assessment models to enhance projections of fire regime responses to global change scenarios.

This project will integrate an unprecedented, multi-decadal earth observation dataset by fusing historical imagery from the 1960-1970s Corona satellite program with the Global Ecosystem Dynamics Investigation (GEDI) lidar and the decades-long GLOBE citizen science initiative.
A 60-year trajectory of land use and fire regime will be reconstructed to isolate the human and climate impacts on shifting fire regimes.

 Funded by NASA Citizen Science in Earth Systems Program, Dr. Biggs’ project provides on ground validation and supporting biodiversity measures for NASA's Earth Systems Monitoring GEDI L4a biomass product in the tropics and global south. This project will engage citizen scientists to collect tree height, diameter at breast height (DBH), and species data that provides on ground validation. This project will take place in Kenya, Ecuador, Malaysian Borneo, and the USA.
The central objective of EMERGE (Earth observations and citizen science for Mosquito-borne disease risk GEomapping and pRediction) is to develop an innovative framework for integrating citizen science data from the GLOBE Program with NASA Earth observations to model and predict mosquito habitats and disease risks under various climate scenarios.

Mosquito-borne diseases cause significant global health
challenges, and climate change is expected to exacerbate these risks
by altering mosquito distribution and abundance patterns. To address
this challenge, the proposed research will leverage the unique
opportunities provided by the GLOBE Program, which engages citizens in
collecting fine-grained, localized data on mosquito habitats and
environmental conditions. These data will then be integrated with NASA
Earth observation data to enhance the spatial and temporal resolution
of mosquito habitat models and disease risk maps.
Dr. Yoseline Angel, a scientist from the University of Maryland-College Park and NASA’s Godard Space Flight Center is inviting GLOBE participants to collect data to aid research on monitoring wildflower blooms.
Dr. Angel hosted a webinar in April 2025 to explain the research relating to tabebuia which is a genus of flowering plant. The research will compare collected photographs of seasonal wildflowers in larger areas with satellite data. One of the long term goals of this research is to provide support to farmers and natural resource managers who depend on these species for pollinators. Obtaining a better understanding of the timing of blooms and how rising temperatures and changing rainfall patterns may impact blooms is one goal of the research. Data collected will help scientists to track pollinator fluctuations, forecast blooms and super blooms, and assess impacts of precipitation trends on the blooms.

The region of interest for this research between March and April 2025 included sites throughout Nevada, California, and Arizona. This novel scalable approach will open the door for more air and space-based research focusing on flowering plants, which represents approximately 90% of all plants on land. A second phase (August 1-October 31, 2025) for this research is requesting GLOBE participants use the GLOBE Observer tool to document and photograph tabebuia trees, especially their blooms in Mexico through Central America and countries throughout South America.
https://www.globe.gov/web/trees-around-the-globe/overview/iops