Explore the sources of aerosols and their effects in the Elementary GLOBE Air Quality Module What's Up in the Atmosphere.
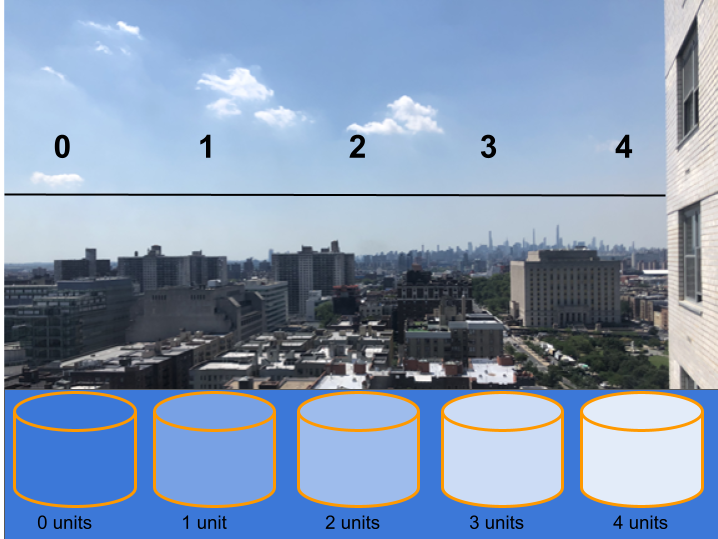
See how aerosols can impact the color of the sky and the visibility toward the horizon with a hands-on activity, Why (Not) So Blue? (This activity accompanies the Elementary GLOBE Air Quality storybook.
Build an aerosol sampler to "catch" visible aerosols and use it to determine differences in aerosols when wind patterns change or on different days.
An aerosol sampler activity that accompanies the Elementary GLOBE Air Quality storybook and can be used for multiple ages is called Up in the Air.
There is also a virtual Sky Color and Visibility activity which can be found on the My NASA Data website. In this activity, learners simulate changes in the amount of aerosols in the atmosphere to see the effects on sky color and visibility.
For High School-Age Community Scientists and Community Scientists of All Ages
The video, Satellite Matching, explains why satellite matches to GLOBE clouds observations are important, and walks you through the process of how you can do this with your own cloud observations.
The video, Wildfire Observations on GLOBE using the Clouds Protocol, describes how to find cloud observations that indicate the presence of smoke and use them to investigate wildfire impacts on air quality by integrating additional data.
Here are some example research questions you could use to get started analyzing your air quality measurements and observations:
How does wind direction affect the air quality in my area?
How is sky color related to Aerosol Optical Thickness?
How do weather variables (temperature, relative humidity, air pressure) affect the air quality in my area?
How can satellite and weather measurements be used to explain air quality events?