Activities, Resources, Online Tools, Blogs and Discussion - Trees around the GLOBE


Hands-on Activities, Videos and Resources

Below are some hands-on activities and resources that can be used as supplements to learning all about the science and observations for each of the prime protocols for the Trees Around the GLOBE Student Research Campaign. It is important to take measurements and observations using these protocols, but it is just as important to understand what the measurements and observations mean in the real world. These activities and resources can help strengthen the knowledge of the science behind these protocol measurements and observations.
Trees:
Activities
Build a Clinometer: Simple Instructions for how to build a paper clinometer (an instrument used to measure angles) and use it to calculate the height of a tree.
Paper Clinometer vs. NASA GLOBE Observer: Trees Tool: To do a comparison of tree height measurements using a hand-held paper clinometer versus the GLOBE Observer: Trees tool for citizen science and to explain any differences between the two measurement methods.
Measure a Tree: What is the tallest object you can measure with a meterstick? A fence? The ceiling? Have you ever disagreed with someone about the height of a tree or building? If you work as a team, you can measure the height of any object!
Tree Impact Study: Trees are among the oldest living organisms on Earth. Because of their size, complexity, and long life, trees provide a habitat, like an island, that rises far above the ground. Your goal in this study is to document the impact of a large tree on the environment of your school or community.
Videos
Using Trigonometry to Determine the Height of a Tall Object: Even though the NASA GO Trees Tool calculates the angles and tree height for you, please take a look at this great reference video that discusses the trigonometry used in calculating heights of tall objects, like trees.
40 Years of Forest Recovery: It has been forty years since Mount St. Helens erupted on May 18, 1980, in southwestern Washington, near the Oregon border. Fifty-seven people lost their lives in the disaster, and huge swaths of the surrounding forest were levelled. Both before and after the eruption, Landsat satellites were taking regular observations of the area, and their data is being used to study how forests recover from a very large disturbance.
Mapping Forests Through Time: Trees are one of the world’s best absorbers of atmospheric carbon dioxide, a greenhouse gas that contributes to climate change. As climate change becomes an increasingly urgent matter, scientists seek to understand the effect of forest changes on the increase of carbon dioxide in our atmosphere. Researchers have used the U.S. Geological Survey and NASA's Landsat data to create 25 years’ worth of annual maps of the lower-48 United States. These maps illustrate disturbances in the country’s forests over time.
A 3D Forest Map: For the tall tree canopy of the Amazon rainforest, 3-dimensional maps made by airborne laser technology are giving scientists a new perspective on tree mortality. The high-resolution scans are created from a light detection and ranging, or LiDAR, instrument that sends out 300,000 pulses of light per second that bounce off of leaves and branches and record their height.
The Secret Life of Forests: Forests in the United States are constantly changing. For four decades NASA and the U.S. Geological Survey's Landsat satellites have kept a steady watch from space, and now scientists are turning yearly data sets into powerful time series that show the evolution of the landscape. In this visualization of false color images taken of the Pacific Northwest from 1984 to 2011, scientists see many different stories. Some are obvious, like the patchwork of logged land that flickers from mature trees (blue) to clear-cut (red) to regrown shrubs (yellow). Some are subtle, like the bark beetle or western spruce budworm infestations (dark red) that pulse across mountainsides. Watch as these and other changes come to life in the video.
El Yunque National Forest, Puerto Rico Tree Canopy Change: In September 2017, Hurricane Maria's lashing rain and winds also transformed Puerto Rico's lush tropical rainforest landscape. The extensive damage to Puerto Rico's forests had far-reaching effects.
Land Cover:
Activities
Make a Landsat GIF: In this activity you will make an animated GIF from a Landsat time series using LandTrendr.
EO Kids: All the Colors of the Leaves: Explore in the colors of the leaves in this activity from page 3 of this EO Kids issue about how NASA sees the seasons change from space.
EO Kids: DIY Glacier: See how glaciers carve the landscape using sand, cornstarch and water in this activity on page 3 of the EO Kids issue about Glaciers.
EO Kids: DIY Landslide: See how earthquakes and intense rain can trigger landslides through a hands-on activity from this issue of EO Kids.
EO Kids: Mini Urban Heat Island: Use an infrared thermometer to record the temperature of different materials at different times to explore the urban heat island effect on page 13 of this issue of EO Kids.
Making A Map: An activity to guide you through making a map, including deciding on a purpose for the map, and adding elements such as a grid, a compass, a scale, a key, symbols, and labels that show how different things relate to each other.
Pace a Pixel Activity Guide: This activity allows you to make more detailed and quantitative measurements along four transects of a 50m by 50m square observation area (pixel) that can be compared with the percentages estimated using the GLOBE Observer: Land Cover tool and satellite-based maps.
Videos
Joint Polar Satellite System (JPSS) Green Vegetation Fraction: Orbiting Earth at different heights and paths, NOAA’s fleet of satellites gives us an important, comprehensive view of our planet. The Geostationary Operational Environmental Satellite (GOES) system is parked in an orbit over the equator and continuously tracks the same area. Meanwhile, the Joint Polar Satellite System (JPSS) is in a lower orbit, flying over the north and south poles to give us a constantly shifting global perspective.
Global Land Cover Change from 8000 BP to -50 BP: This video animation shows the global pattern of human land use over the last eight thousand years, a time when human populations began expanding following the origins of agriculture. The earliest areas of human land use are in Mesopotamia and the Fertile Crescent areas of southwest Asia, followed by increasing areas of land use in China, India, and Europe.
Greenings and the Carbon Cycle:
Activities
Why do the leaves change color?: Learn why and how the autumn change of trees happens. With the advancing autumn, the number of hours of sunlight and the temperature decreases. Trees feel the loss of light due to chemical light receptors. They respond to the change by preparing for dormancy (a state of suspended growth and metabolism). For deciduous trees, the most visible manifestation of this change is leaf color change and green-down.
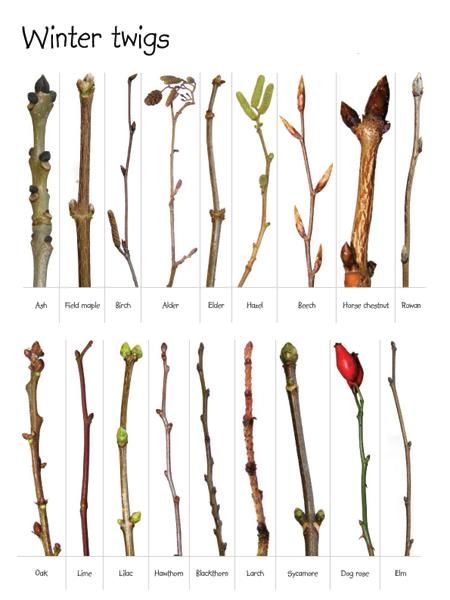
Winter twigs: A pictorial key to recognizing buds
Activities for Spring
Tree Growth Game: European Phenology Campaign Spring Activity #1: My Tree + Carbon Activity: There is invisible carbon in the air, which can be absorbed by a tree and transformed into its body - leaves and wood. Trees bind a large amount of carbon dioxide and water.
Look at the Buds: European Phenology Campaign Spring Activity #2: Data Sheet + Carbon Around Me : An activity that focuses on the buds of a tree during greening.
Carbon in my Tree: European Phenology Campaign Spring Activity #3: First Leaves + Carbon Activity: Look at the budburst in my tree. Growing trees build in carbon into their biomass. CO2 is bound from the air by photosynthesis and released back by breathing. Carbon is also released by decay (fallen leaves, old wood).
My Green Up Data: European Phenology Campaign Spring Activity #4: My Green Up Data + Data Upload Guide + carbon activity: Looking at your Green-Up data during the Spring.
Green Color Scale: European Phenology Campaign Spring Activity #5: What color green are the leaves from your local trees?
Activities for Autumn
My Tree and How Tall is my Tree?: European Phenology Campaign Autumn Activity #1: You can continue to observe the same tree(s) as in the Spring
Color Change of Leaves: European Phenology Campaign Autumn Activity #2: Observing the color changes of the leave on your tree(s)
My Green Down Data: European Phenology Campaign Autumn Activity #3: Looking at your Green-Down data during the Autumn
Videos
Vegetation Greening Trend in Canada and Alaska 1984-2012: High-latitude regions have been warming rapidly since the last century, at a rate higher than the global average. At continental scales, satellite data since the 1980s have indicated increased vegetation productivity (greening) across northern high latitudes, and a productivity decline (browning) for certain areas of undisturbed boreal forest of Canada and Alaska.
Global Transport of Smoke from Australian Brushfires: The local impacts of the Australian bushfires have been devastating to property and life in Australia while producing extreme air quality impacts throughout the region. As smoke from the massive fires has interacted with the global weather, the transport of smoke plumes around the global have accelerated through deep vertical transport into the upper troposphere and even the lowermost stratosphere, leading to long-range transport around the globe.
Real World: The Carbon Cycle - Essential for Life on Earth: Carbon is an essential building block for life. Learning how carbon is converted through slow- and fast-moving cycles helps us understand how this life-sustaining element moves through the environment. Discover, with Dr. Lola Fatoyinbo, how NASA measures carbon through both field work and satellite imagery keeping watch through its eyes on the sky, on Earth, and in space.
Our World: Where Do Crops Grow: Have you ever wondered where food comes from? Learn how Dr. Catherine Nakalembe uses NASA satellite data to show the health and location of crops around Our World. Maps created from these data help people become more food secure. You can help, too. Using the GLOBE Observer App, you can help scientists validate satellite data by describing land covering through the Adopt a Pixel program.
*Note: If you know of additional activities and resources that should be included below, email Brian Campbell (Brian.A.Campbell@nasa.gov).