NOAA – State of the Climate: A look at Africa


Diversity, Equity, and Inclusion (DEI) Task Force
Important: The GLOBE DEI Task Force has transitioned into the GLOBE Diversity, Equity, and Inclusion Working group. For all current information related to DEI at GLOBE, check out the GLOBE DEI Working Group page.
With the support of GLOBE Program Sponsors from NASA and NSF, in the fall of 2019 the GLOBE DEI Task Force was formed with the goal of creating a GLOBE statement and implementation plan on Diversity, Equity and Inclusion. In February 2020 the group met in Boulder, Colorado for a DEI workshop, and to begin working on these statements. This group has met monthly ever since to collaboratively produce the statements shown below. These statements and action plan were presented to the GLOBE Community at the 2020 Virtual Meeting. A recording of this presentation can be found on GLOBE's Annual Meeting videos page.
DEI Task Force Members
| Shadrack Agyiri (Ghana) | Jill Karsten (USA) |
| Jennifer Bourgeault (USA) | Julie Malmberg (USA) |
| Katie Chapman (USA) | Josette Neal-De-Stanton (USA) |
| Kimberly Davis (USA) | David Padgett (USA) |
| Mindi DePaola (USA) | Richard Parsons (USA) |
| Francis Emralino (Philippines) | Marina Pavlic (Croatia) |
| Wrayna Fairchild (USA) | Ana Prieto (Argentina) |
| Trena Ferrell (USA) | Nate Raynor (USA) |
| Rosalba Giarratano (USA) | Juan Felipe Restrepo Mesa (Colombia) |
| Kate Goss (USA) | Elena Sparrow (USA) |
| Nikitah Imani (USA) | Josephine Joy Tolentino (Philippines) |
Action Plan (detailed):
- Create DEI Working Group
- Administer DEI Assessments
- Build a DEI Standard Operating Procedure (SOP)
- Develop DEI based Resources
- Establish DEI Training Opportunities
- Form DEI Supportive Partnerships
- Find funding for DEI
- Communicate DEI Initiatives
To see translations of the draft DEI Definitions, Mission, Vision and overview of the Draft Action Plan, click here.
Recent DEI-Related Blog Posts
In a recent blog post, we shared with you the NOAA State of the Climate report for 2010. These annual reports provide a summary of the global climatic conditions and are a great benchmark for monitoring climate. Along with the global summary, the report summarizes regions. The regions very closely overlap with the GLOBE Regions! We will go through the report and provide a summary for each GLOBE Region. A review of the Regional summaries is a great way for you to see how the climate of your region compared with the regions of other GLOBE Schools. We will start off with Africa.
All the Regional reports provide a tremendous amount of information. The temperature and precipitation climate summaries are highlighted here, but if you were interested you could get more information about the Africa Region state of the climate from this website:http://www1.ncdc.noaa.gov/pub/data/cmb/bams-sotc/2010/bams-sotc-2010-chapter7-regional-climates-lo-rez.pdf
Temperature
Temperatures for 2010 for the entire region were above normal for the entire year. Each sector, which is broken down below, saw different magnitudes of this warmth but each saw differences of at least +0.8 degrees C above normal. For southern Africa, 2010 was the second warmest year since 1961.
Precipitation
Precipitation for 2010 isn’t nearly as easy to describe in general terms, as various locations in the African Region saw dramatic differences. Precipitation is much more difficult to summarize than temperature because it relies on many different factors, such as the migration of weather systems across an area. Even locations in the same country can receive vastly different precipitation. So in order to better describe the precipitation across Africa, the continent is broken down into four sectors: west, east, south, and ocean, as shown in the figure below:
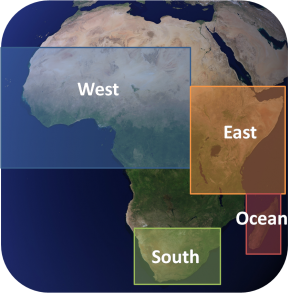
The west sector includes the GLOBE countries of: Benin, Burkina Faso, Cameroon, Cape Verde, Chad, The Republic of Congo, Gabon, Gambia, Ghana, Guinea, Mali, Niger, Nigeria, and Senegal.
In the northern portion of this region, the Sahel experienced rainfall amounts that made 2010’s rainy season the wettest since 1958. In the southern portion of the region, rainfall was significantly less than normal. The significant rain fall that fell in during the rainy season in the Sahel caused widespread flooding in many places, including the GLOBE countries of Senegal and Guinea.
The east sector includes the GLOBE countries of: Ethiopia, Kenya, Rwanda, Tanzania, and Uganda.
For the first half of 2010, the northern portion of the east sector saw above average rainfall, including Ethiopia, Kenya, Rwanda, and northern Uganda. In Tanzania, however, rainfall amounts were less than normal, where rainfall amounts were only approximately 25-75% of normal values. The second half of 2010 saw a change in rainfall, where amounts dropped to be below or near average. Regions of Kenya saw less than 25% of their normal rainfall from September through December. The below average rainfall during the months of September through December resulted in widespread stress on climate-dependent industries. These include crop failure, water limitations for both industrial and domestic use, water contamination, and malnutrition.
The south sector includes the GLOBE countries of: Namibia and South Africa.
In general, the rainy season in this region did not see major departures from normal. However, South Africa saw many extreme events. January started out with heavy rain and flooding in the northeast portion of the country, and by June, snow was reported in areas for the first time in 18 years in central South Africa. Extreme events were also noted, with severe hailstorms, lightning-ignited wild fires, and tornadoes.
The final sector of interest is the ocean, which includes the GLOBE country Madagascar.
The majority of Madagascar saw below average rainfall for 2010, with the exception of the southeast coast and a line running east-west through Antsakabary. These extreme deficits in rainfall caused the government to impose strict water supply restrictions due to the dam being at only 50% capacity.
As you can see the climate variability is very significant across the continent! There is much more detail in the actual report summary: http://www1.ncdc.noaa.gov/pub/data/cmb/bams-sotc/climate-assessment-2010-lo-rez.pdf. You can see how critical it is to understand climate from the notable events summarized for each area.
How does your record of GLOBE data for the past year compare to the summary provided here? Were the data similar or different to the NOAA climate summary? What kind of significant events have you had in your local area? Share them with us through the comment option below!
Check back next week when we will take a look at 2010 for the Asia-Pacific Region.
-jm