Science of ENSO - El Niño


The Science of the El Niño Southern Oscillation
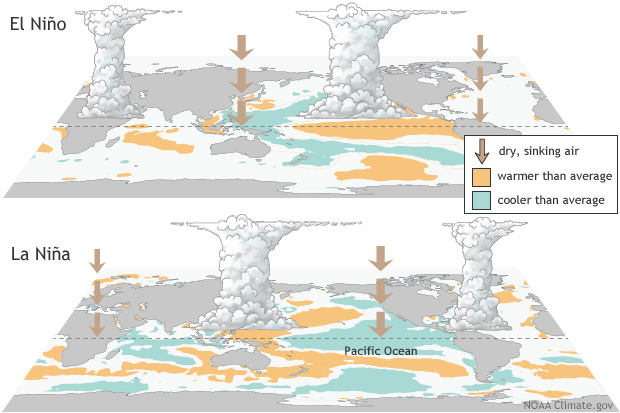
El Niño and La Niña are the warm and cool phases of a recurring climate pattern across the tropical Pacific—the El Niño-Southern Oscillation, or “ENSO” for short.
The pattern can shift back and forth irregularly every two to seven years, and each phase triggers predictable disruptions of temperature, precipitation, and winds.
These changes disrupt the large-scale air movements in the tropics, triggering a cascade of global side effects.
Source: https://www.climate.gov/enso
|
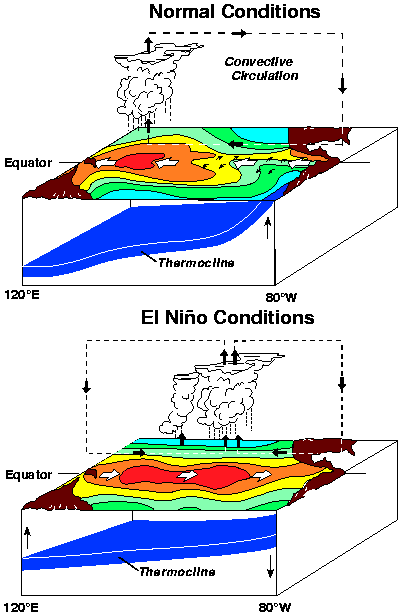
The El Niño/La Niña are shifts in ocean temperature in the Pacific Ocean, shown in the red to blue contours on the surface in the diagram above. The Southern Oscillation is the pressure change between Tahiti and Darwin, Australia, which affects the strength and direction of the winds. Together they are referred to as ENSO. In normal, non-El Niño conditions (left, top diagram) the trade winds blow to the west along the equator from South America towards Asia in the tropical Pacific Ocean. These winds pile up warm surface water off Asia, so that the sea surface is about 1/2 meter (1 1/2 feet) higher at Indonesia than at Ecuador in South America.
|
The El Niño phenomenon can have an impact on weather conditions around the globe, for both the winter and summer periods, as seen in the maps below. The key shows which areas will be wetter, drier, warmer and cooler than normal.
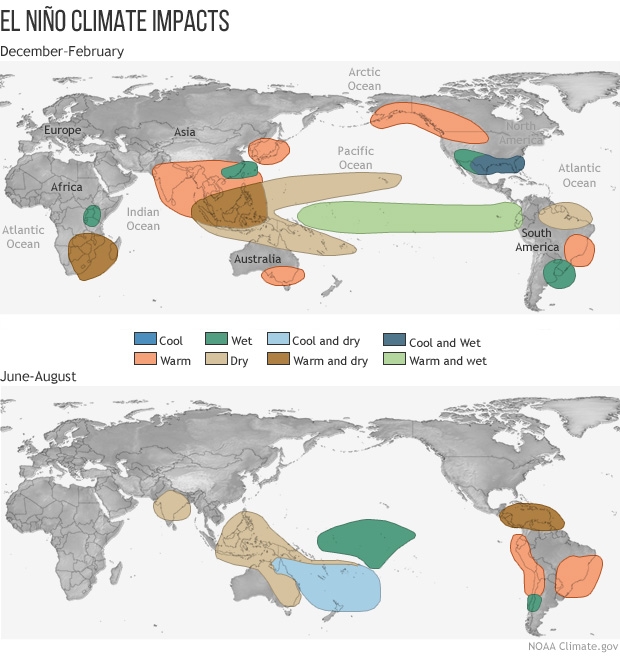
Source of diagrams and some text: http://www.pmel.noaa.gov/tao/elnino/el-nino-story.html and http://www.pmel.noaa.gov/elnino/impacts-of-el-nino
ClimateBits: El Niño
NASA: Observing the 2015 El Niño