PACE Foliage Updates - North America


PACE Fall Foliage Updates
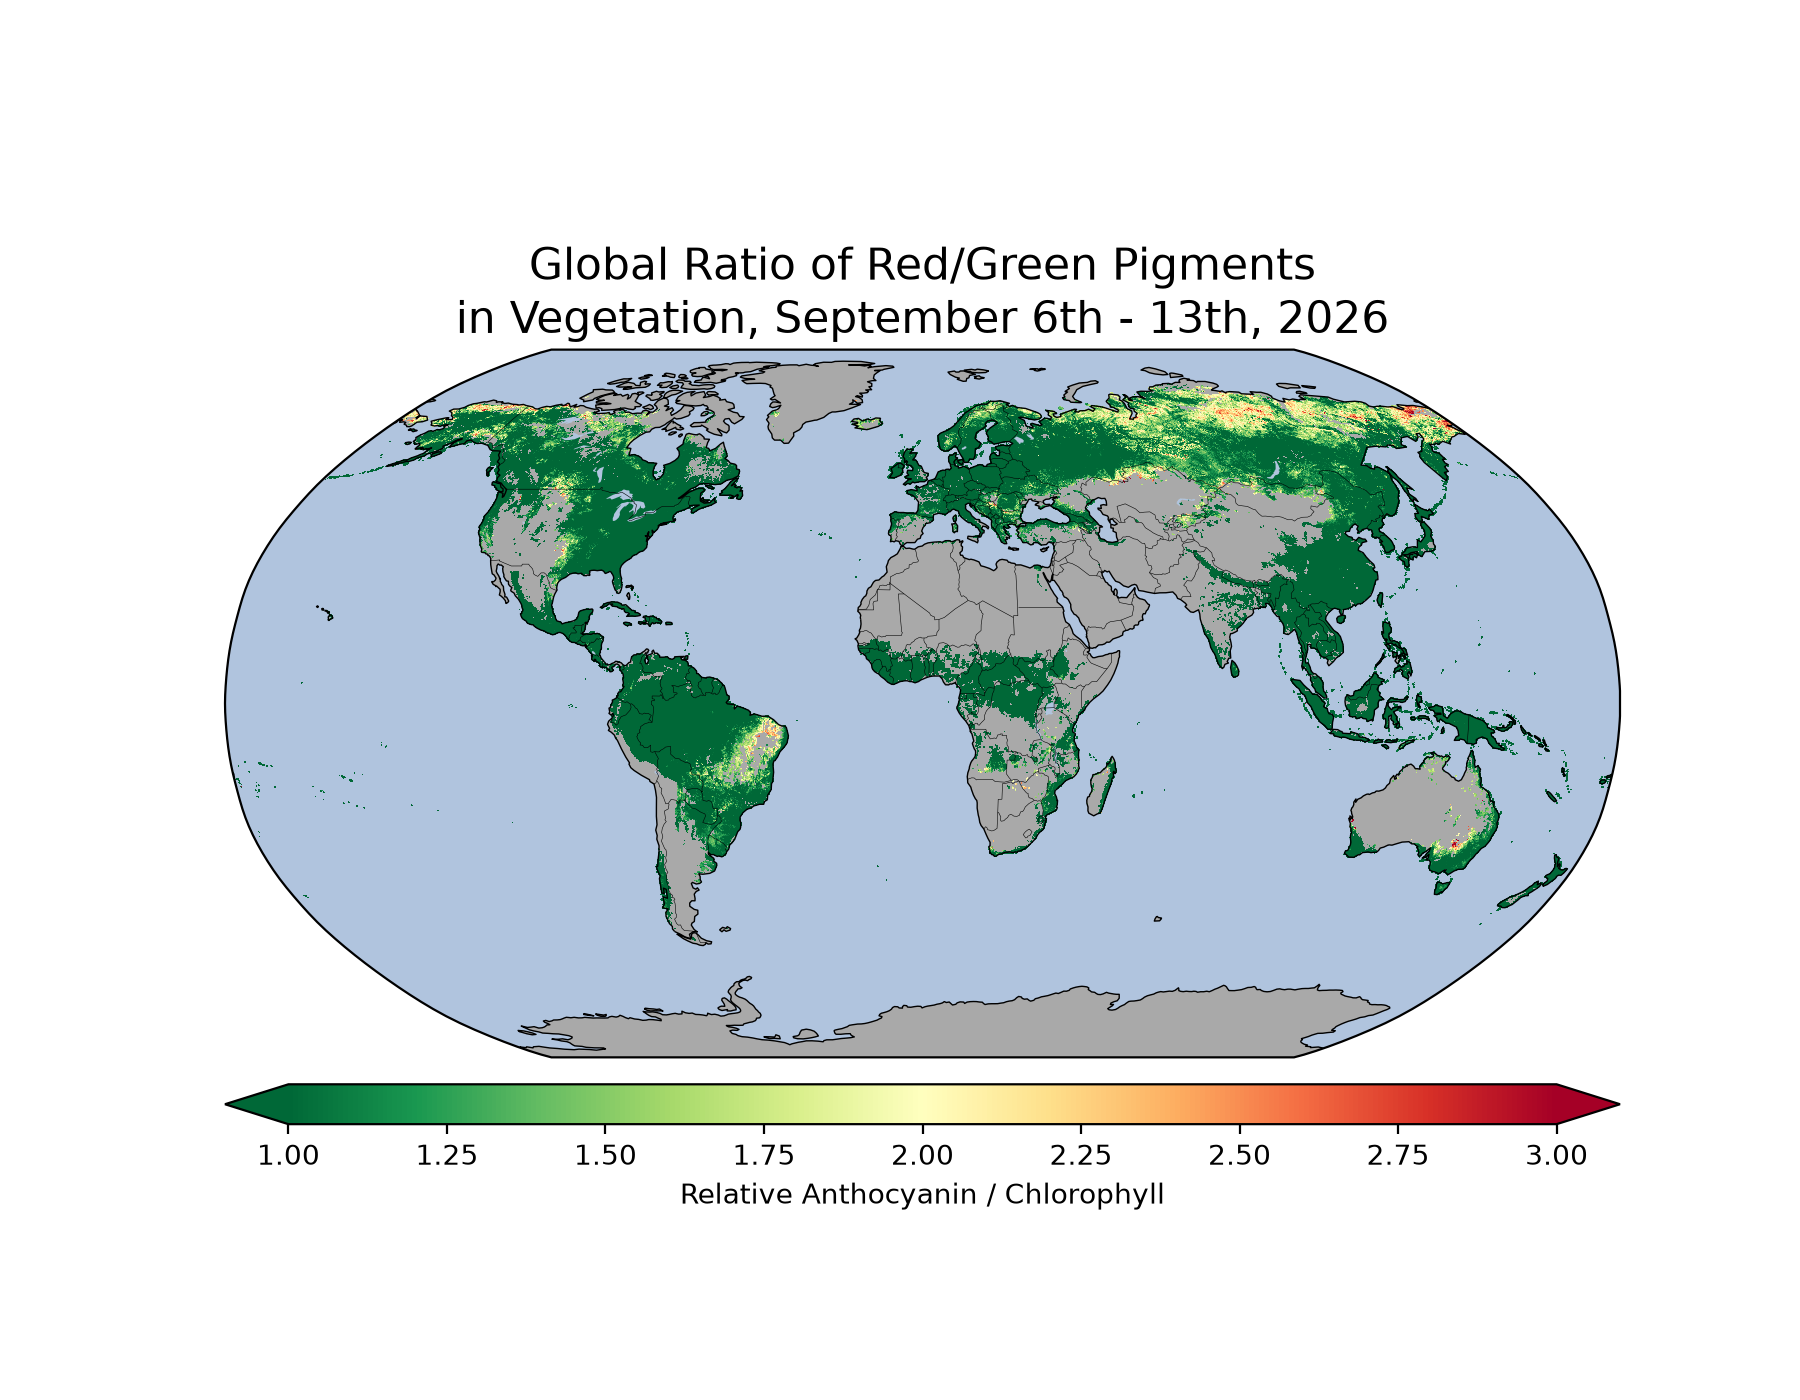
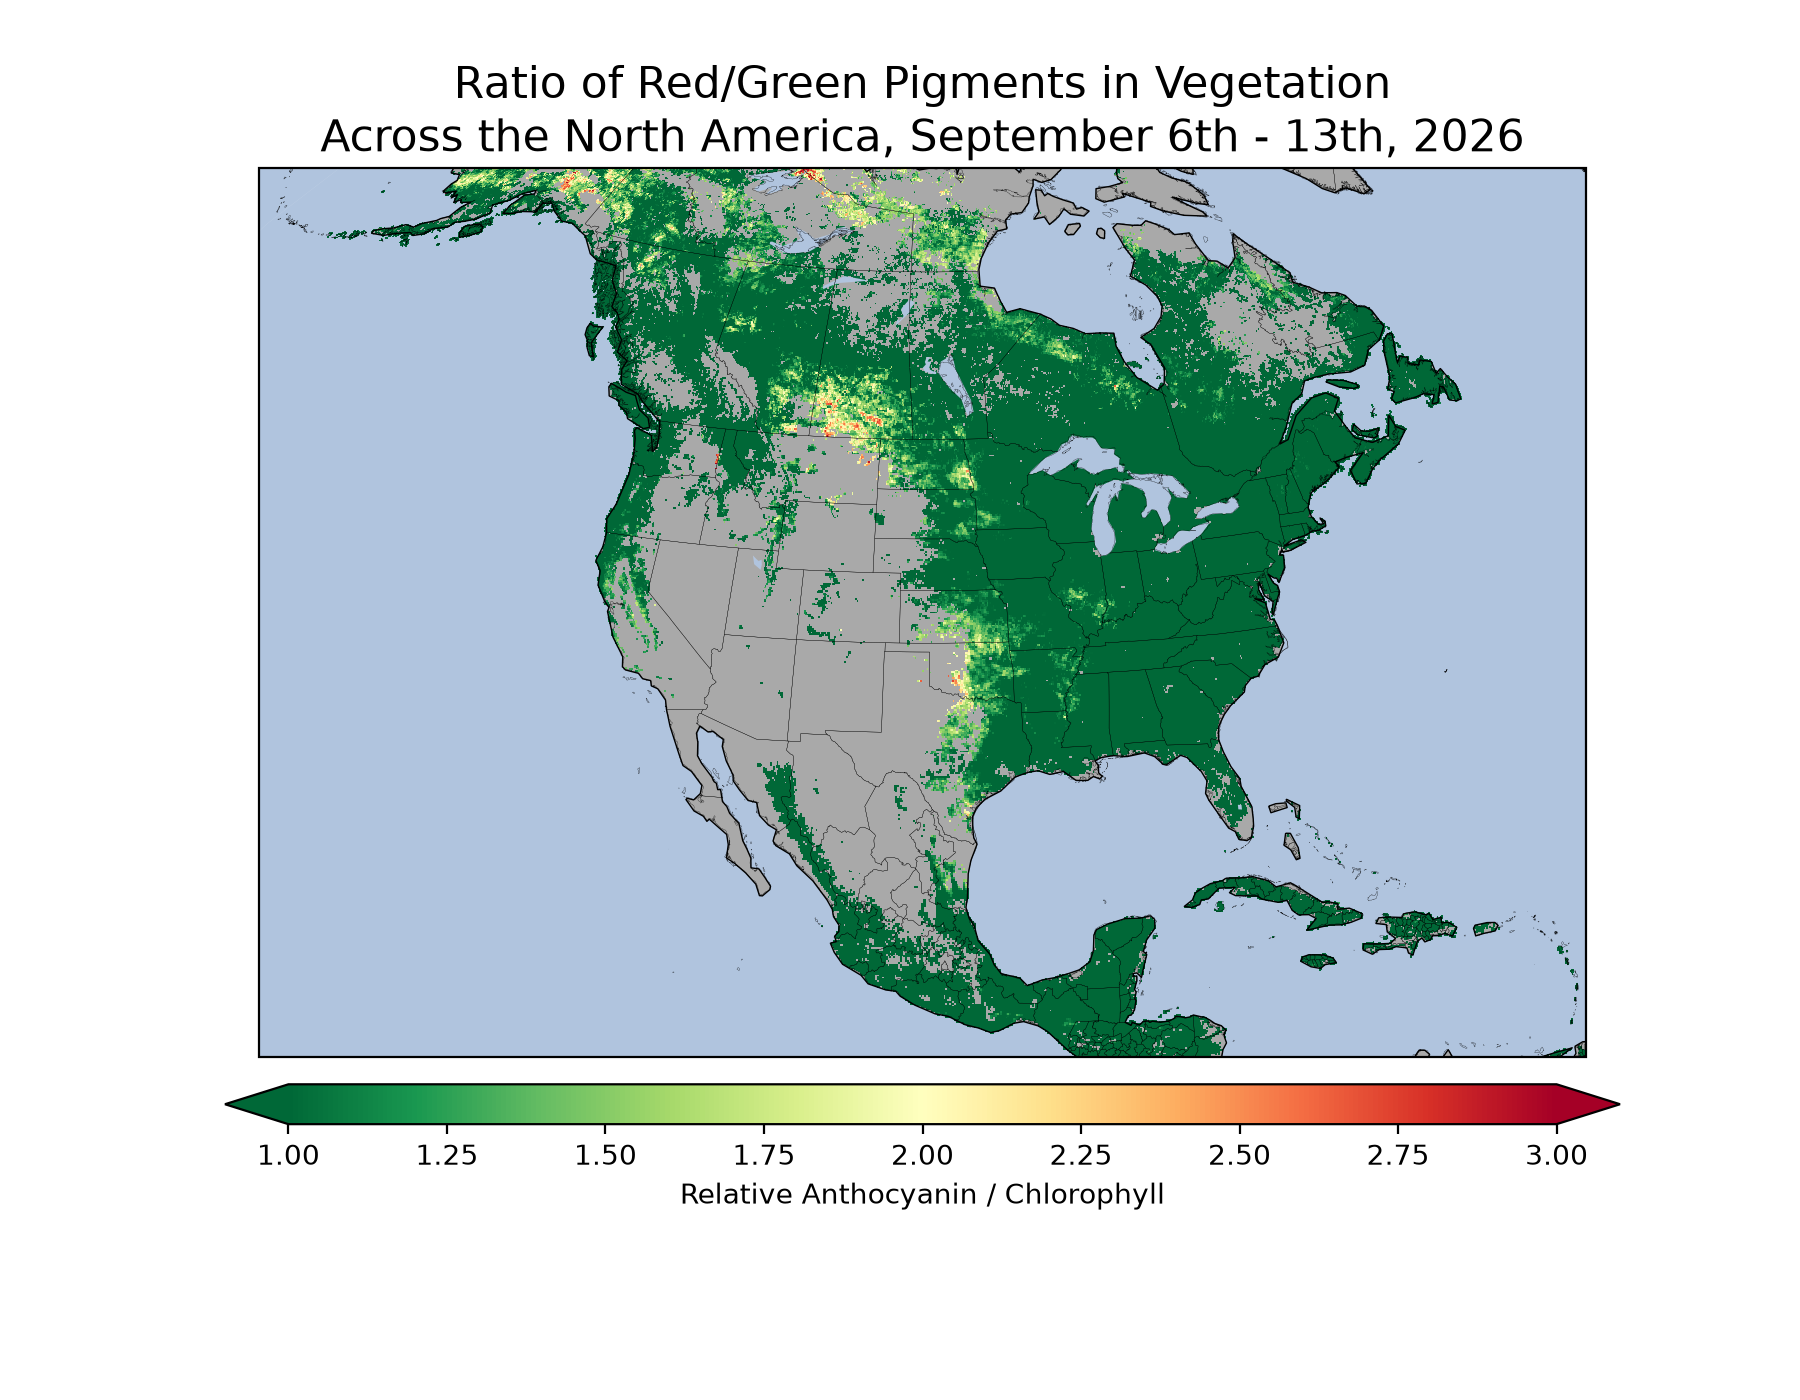
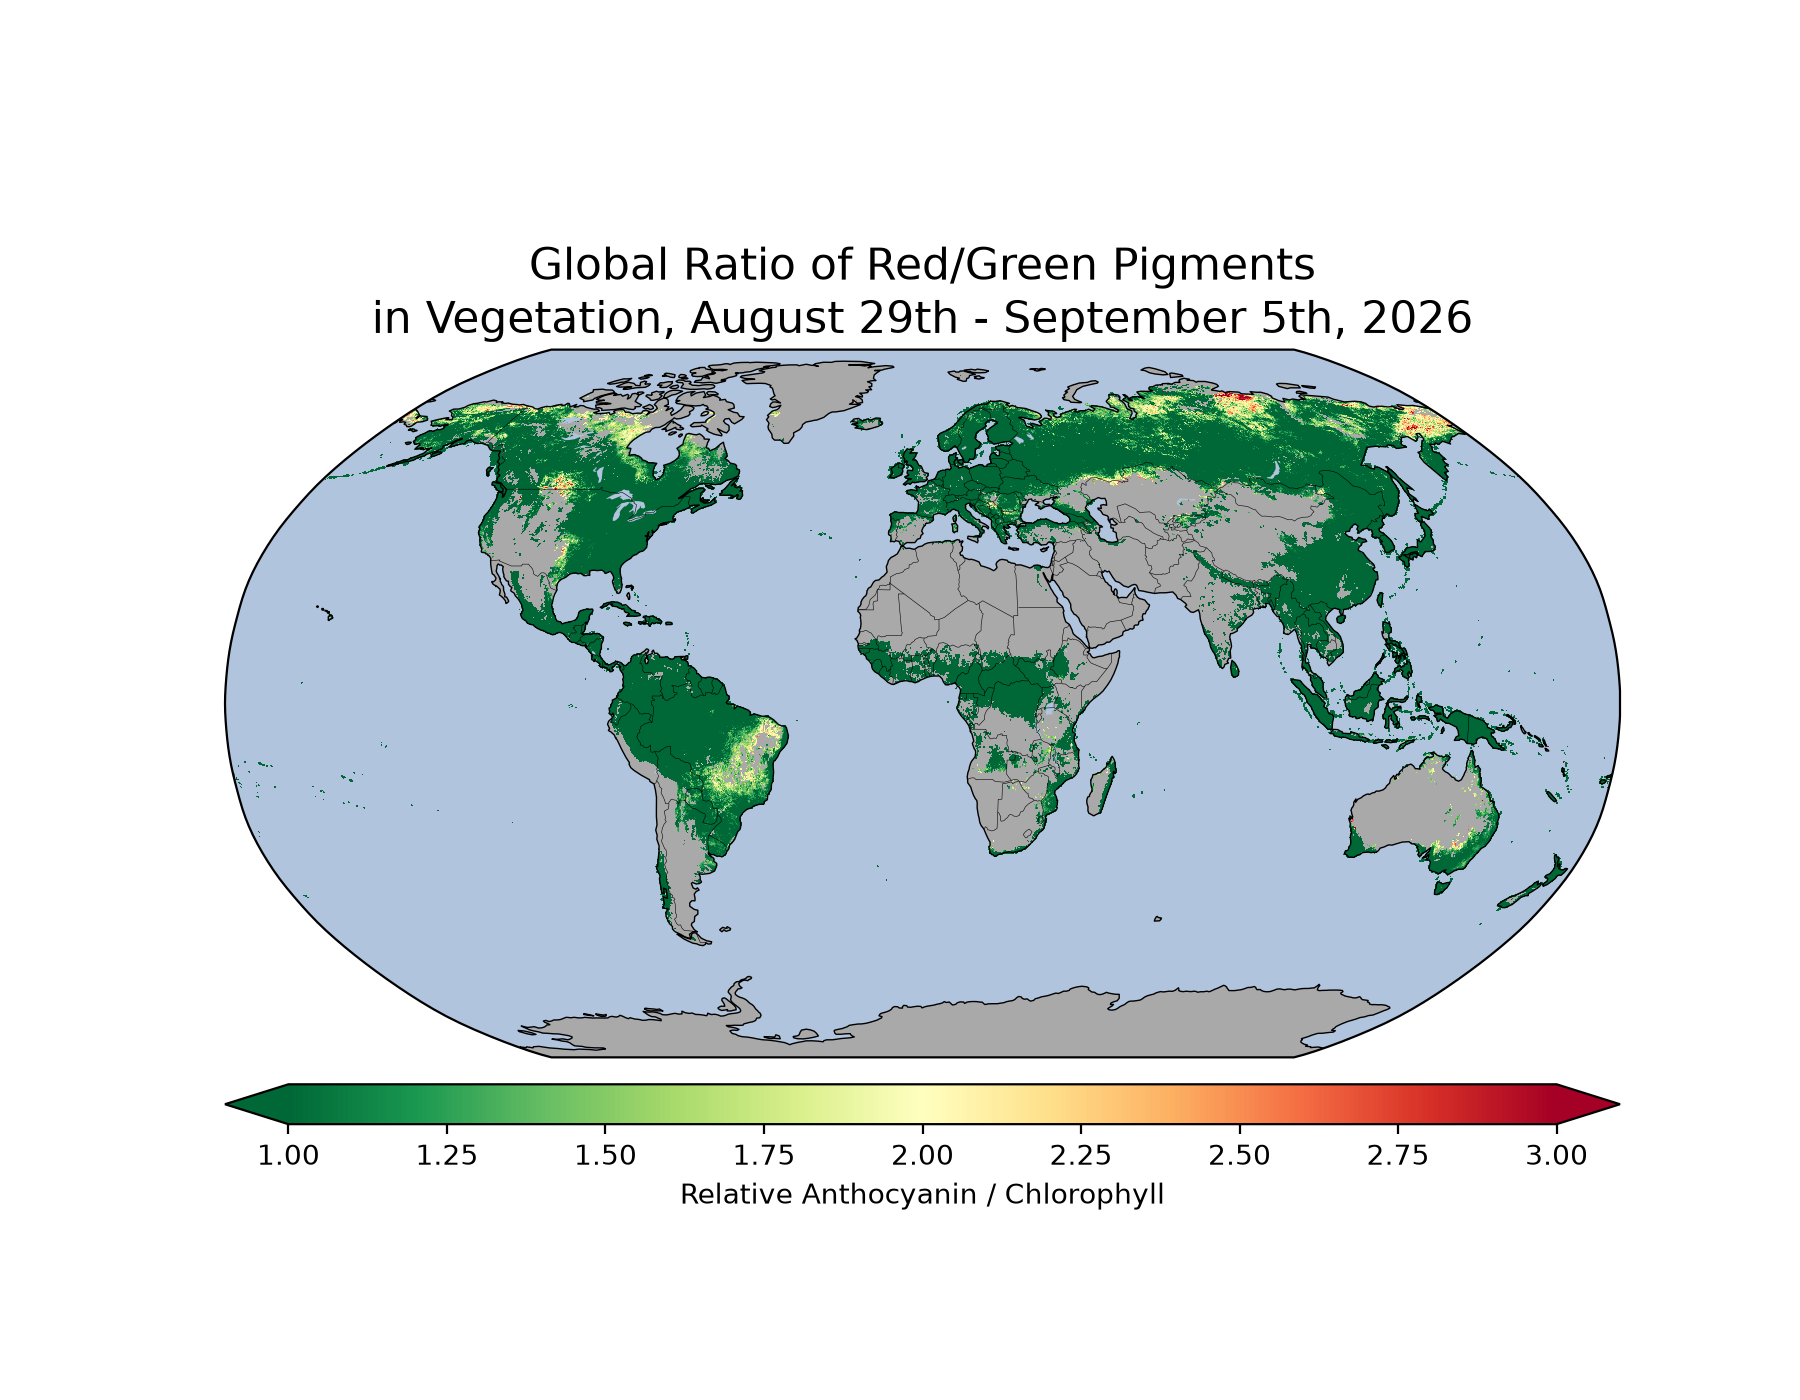
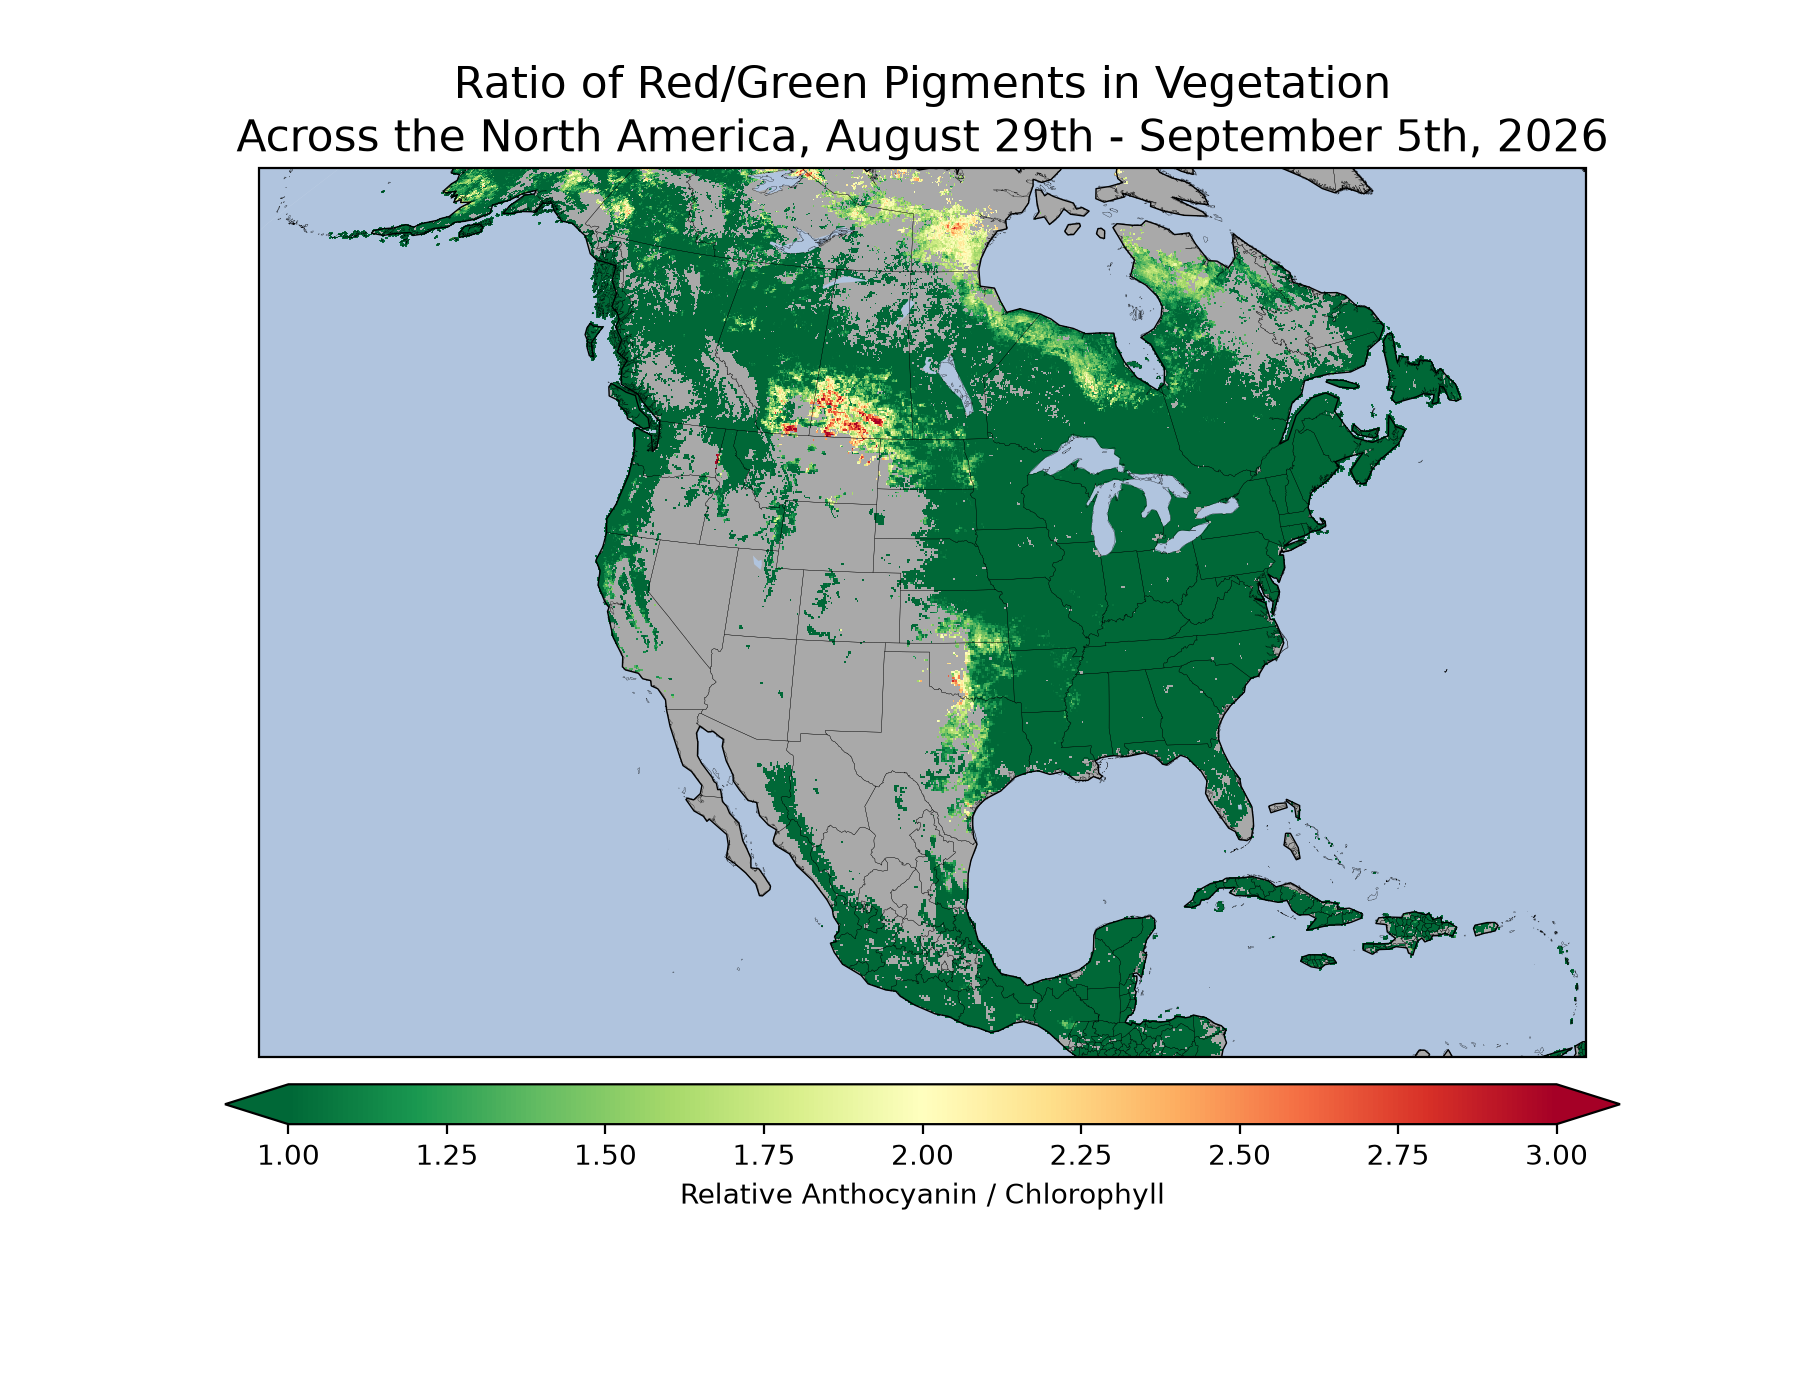
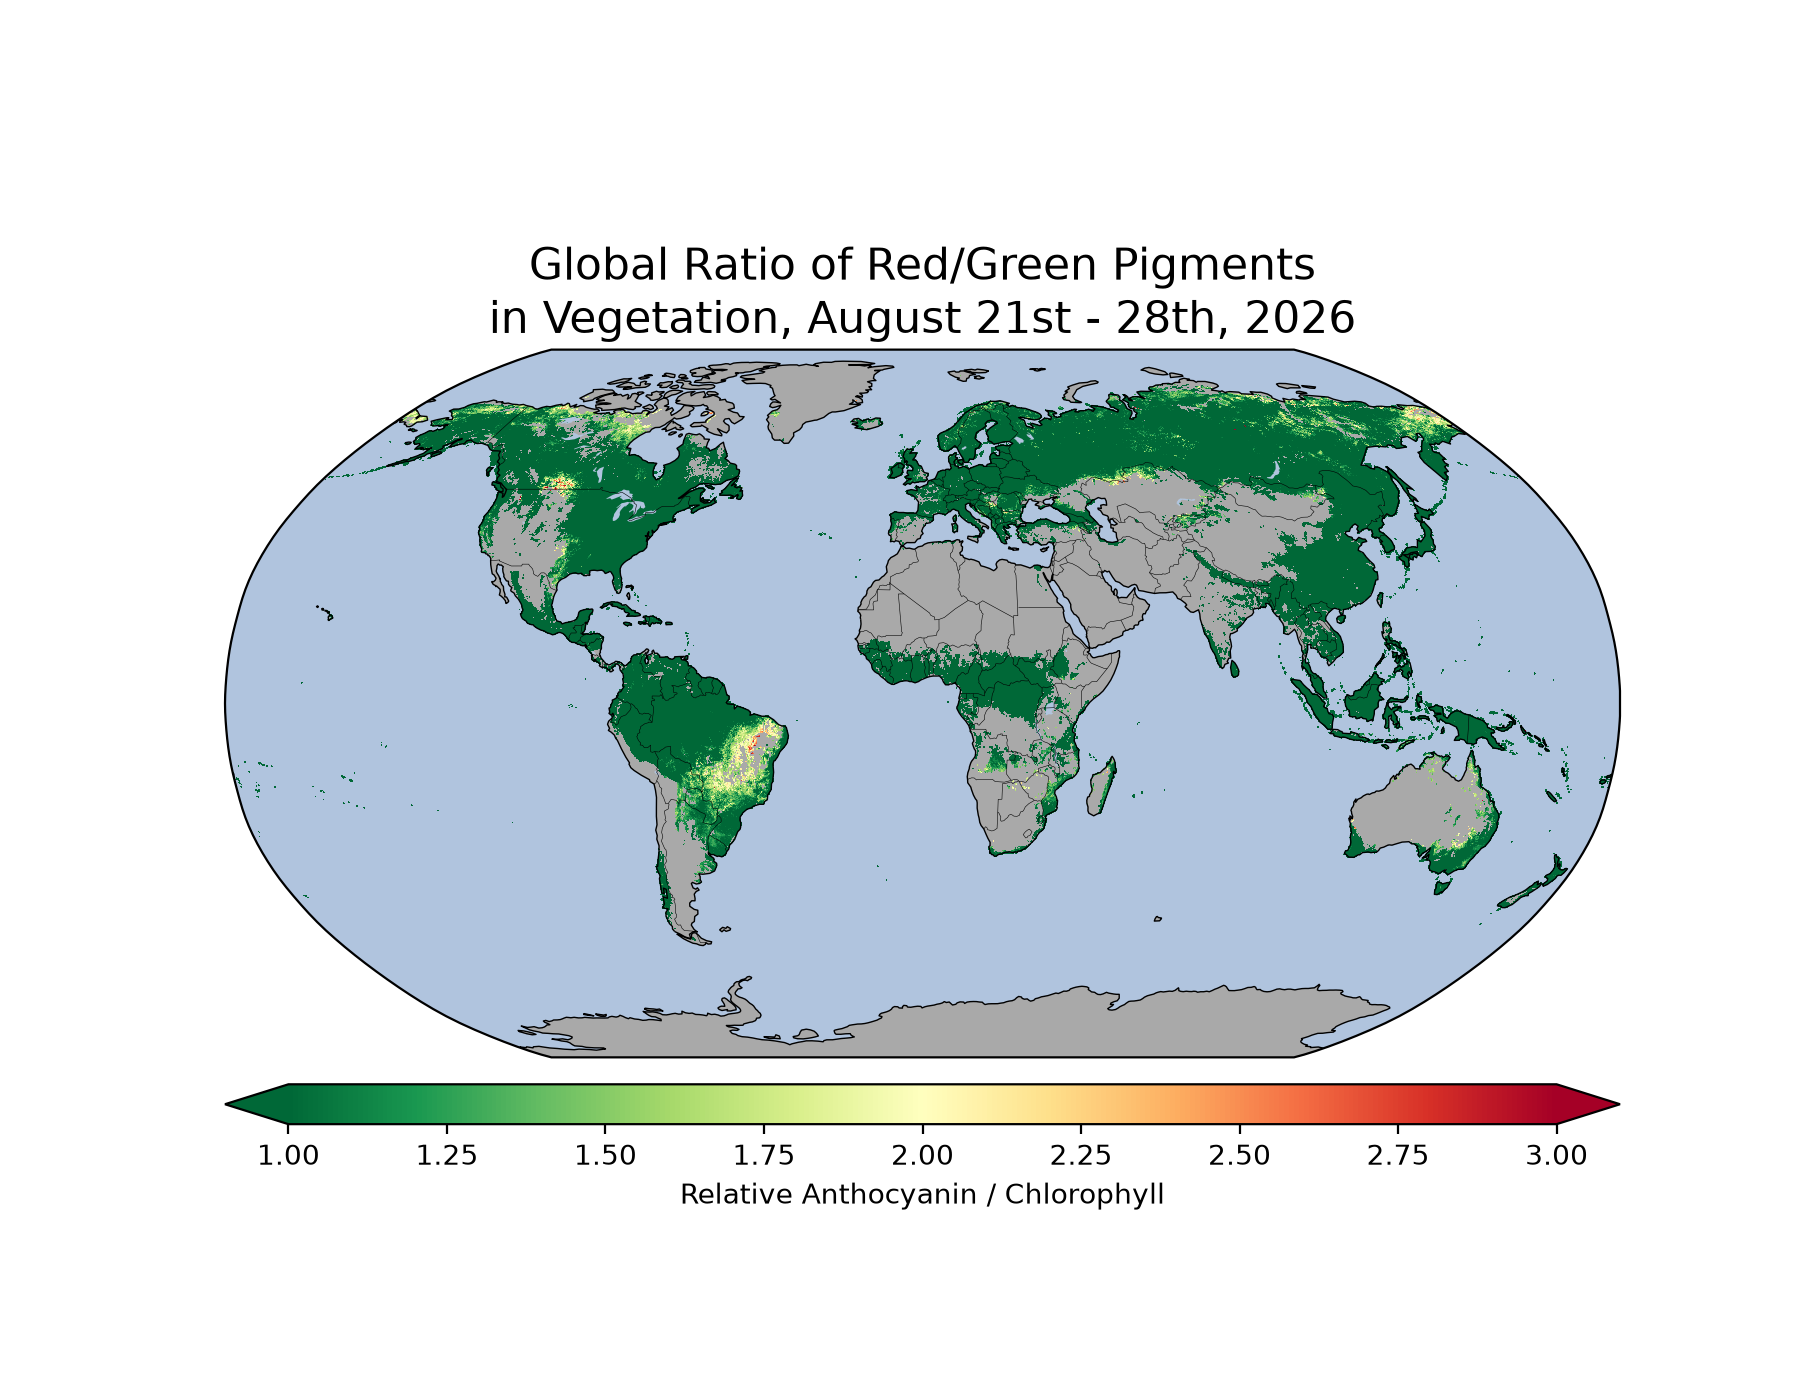
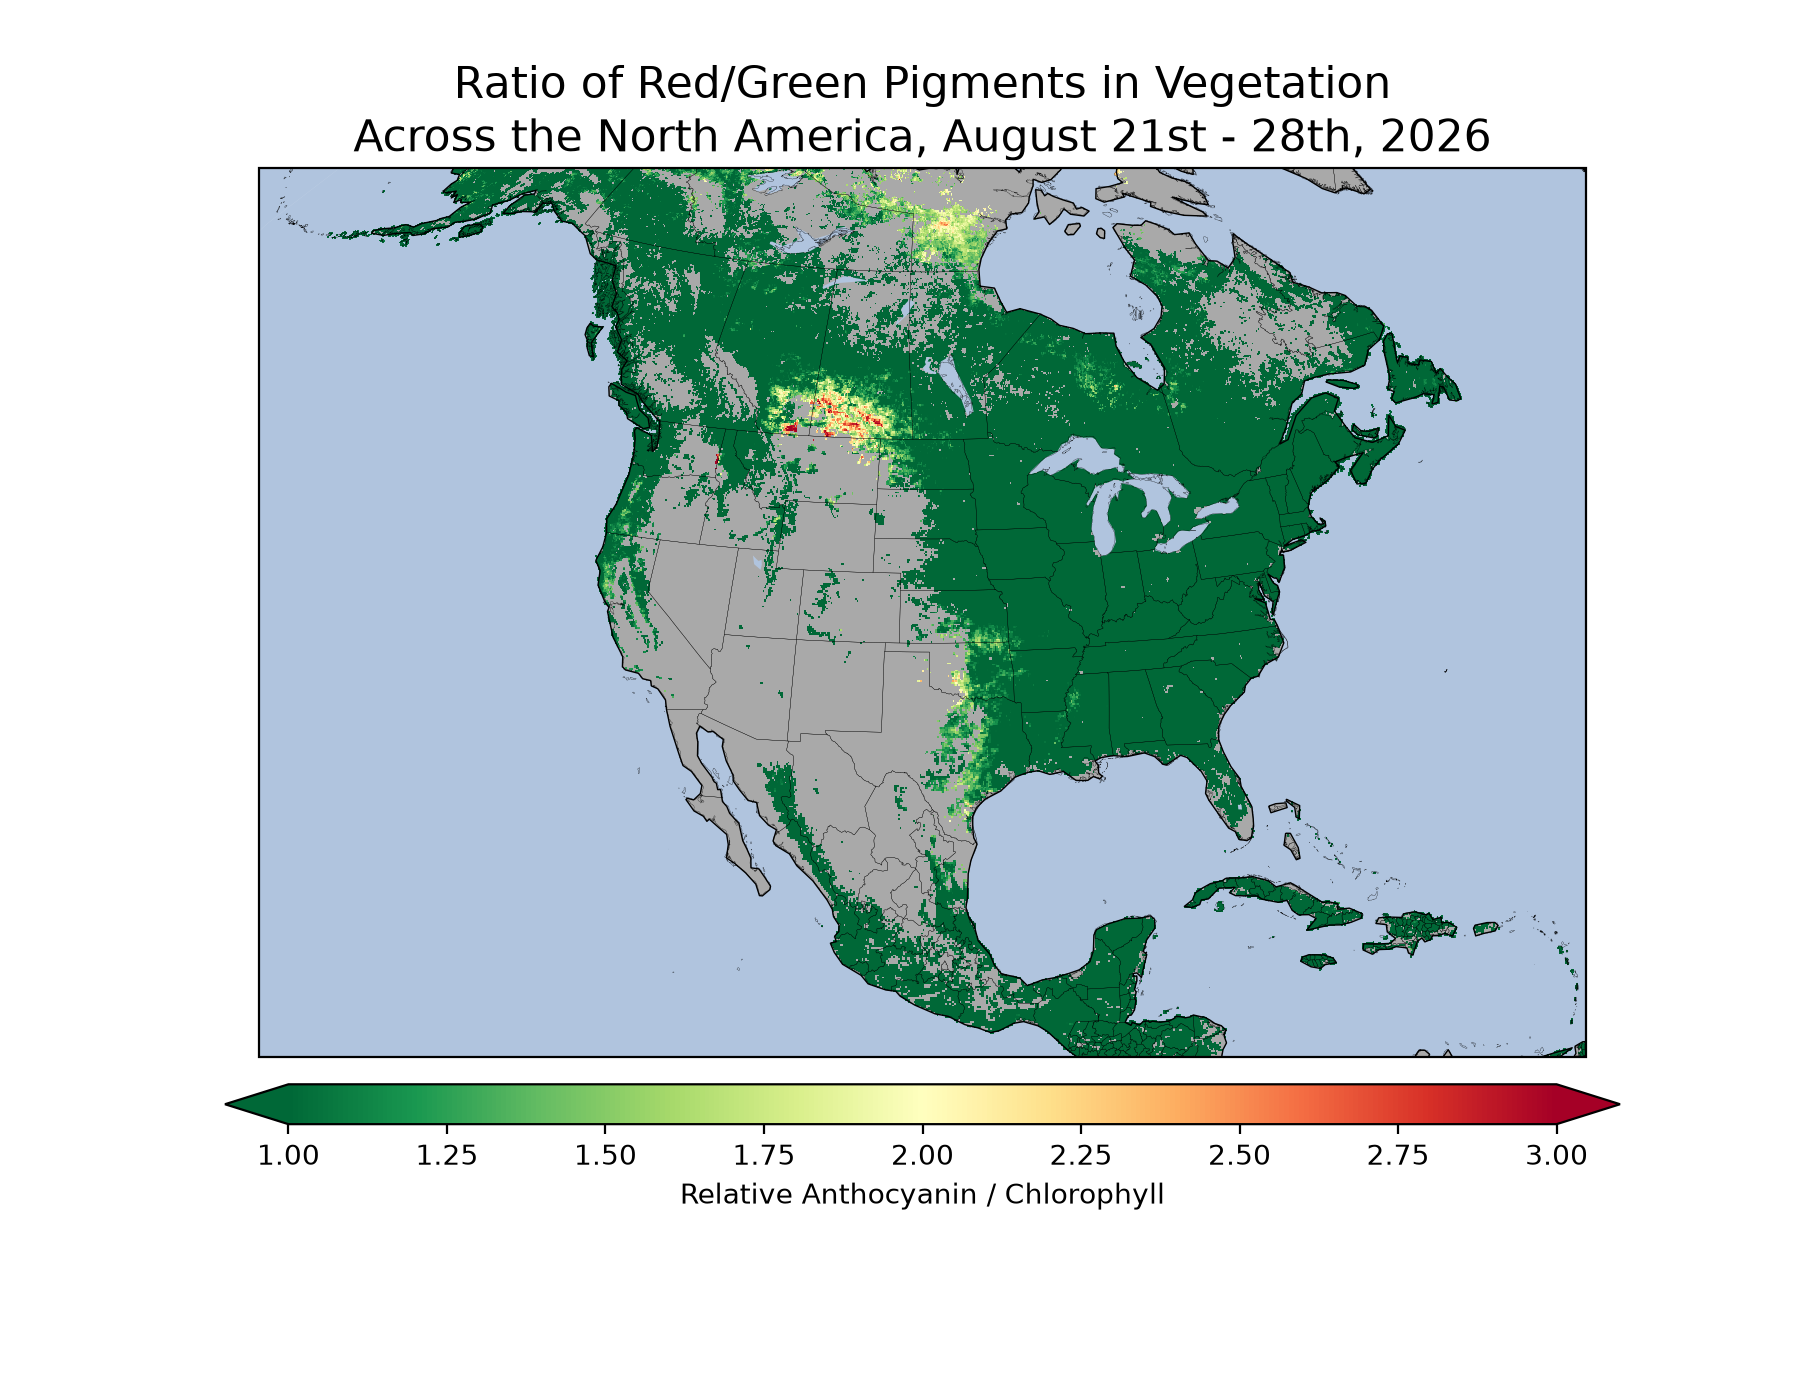
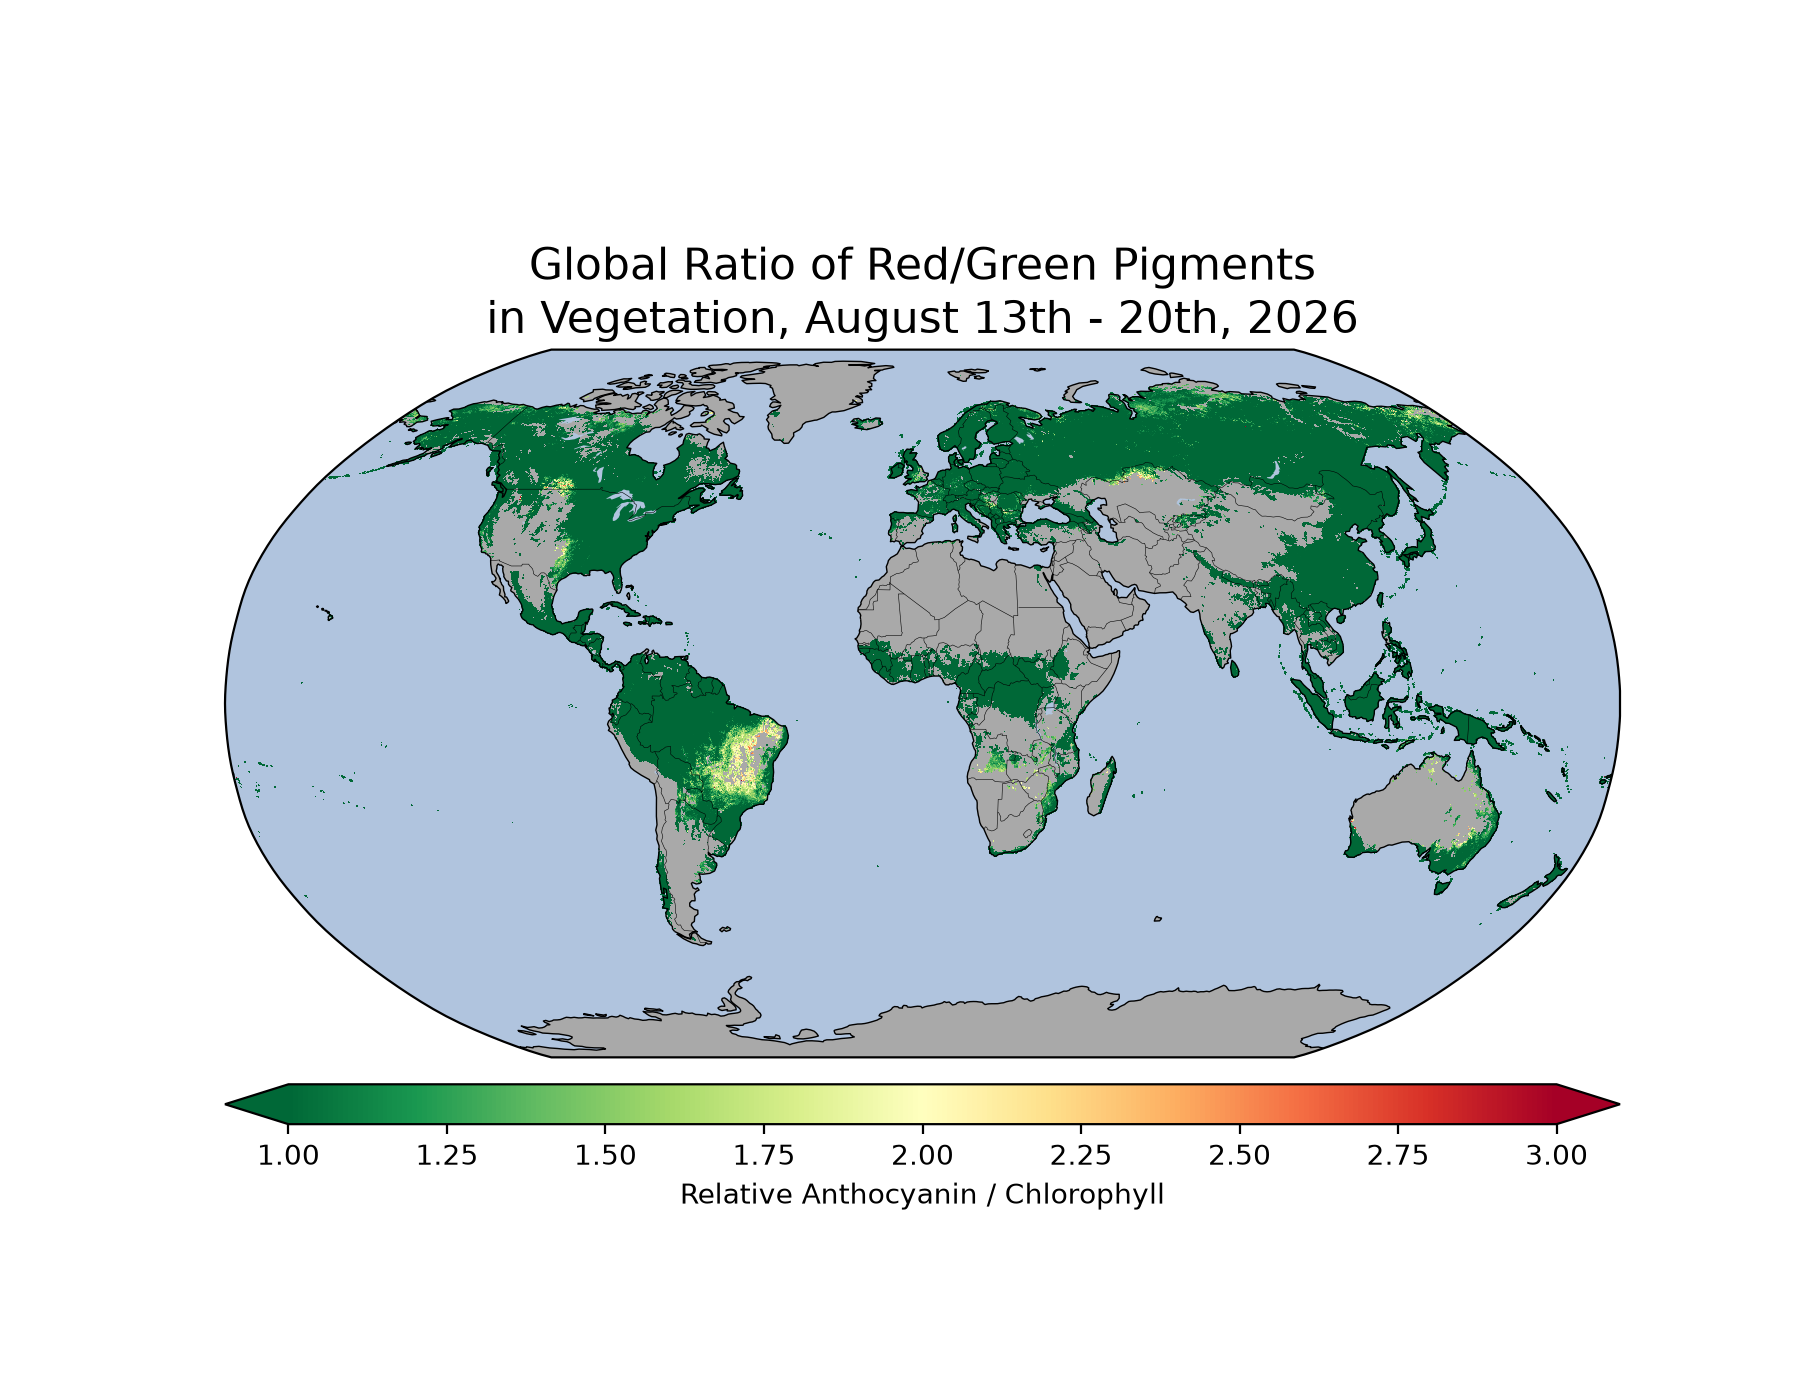
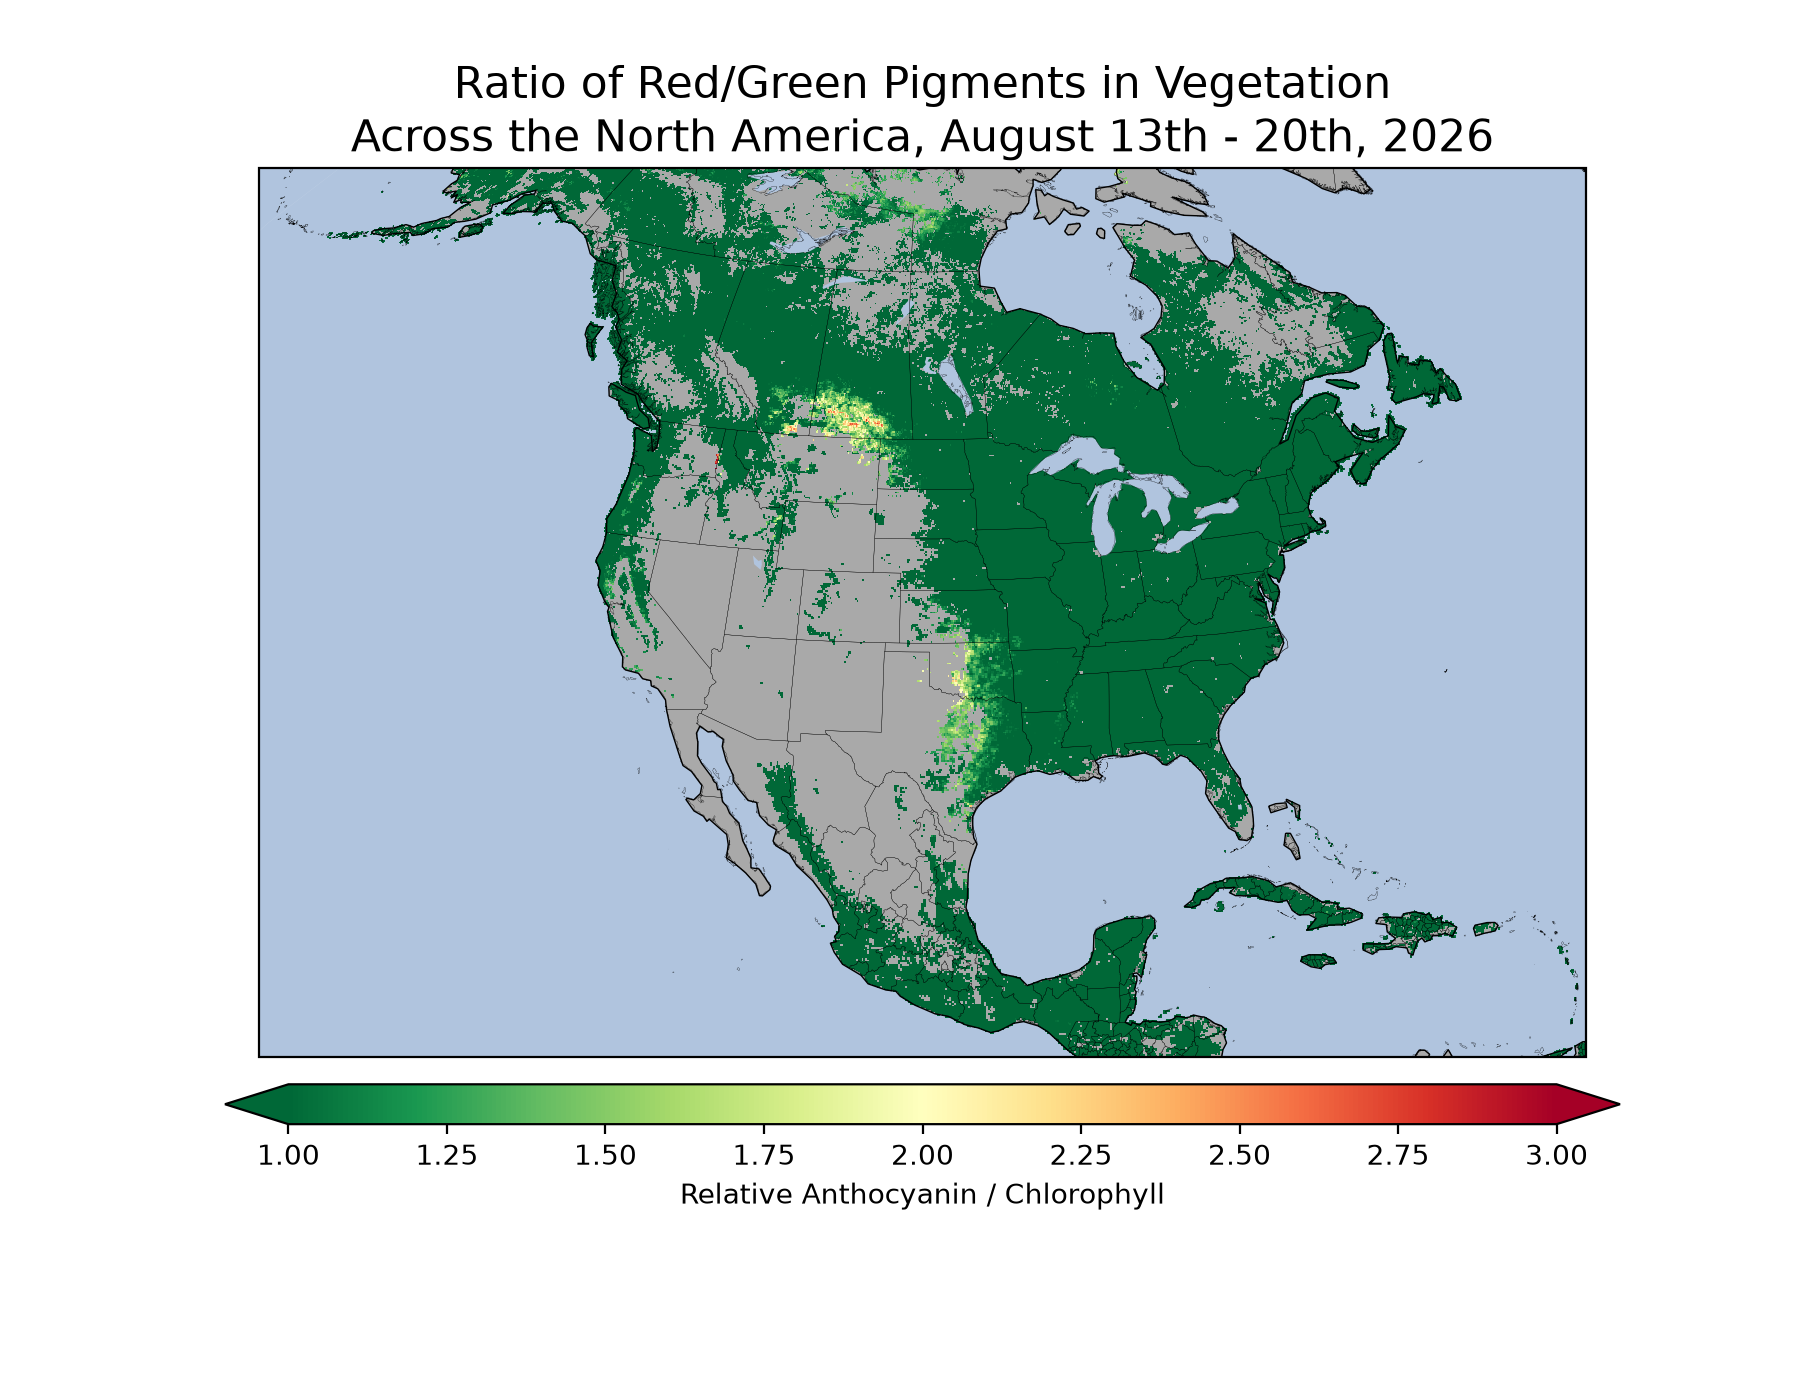
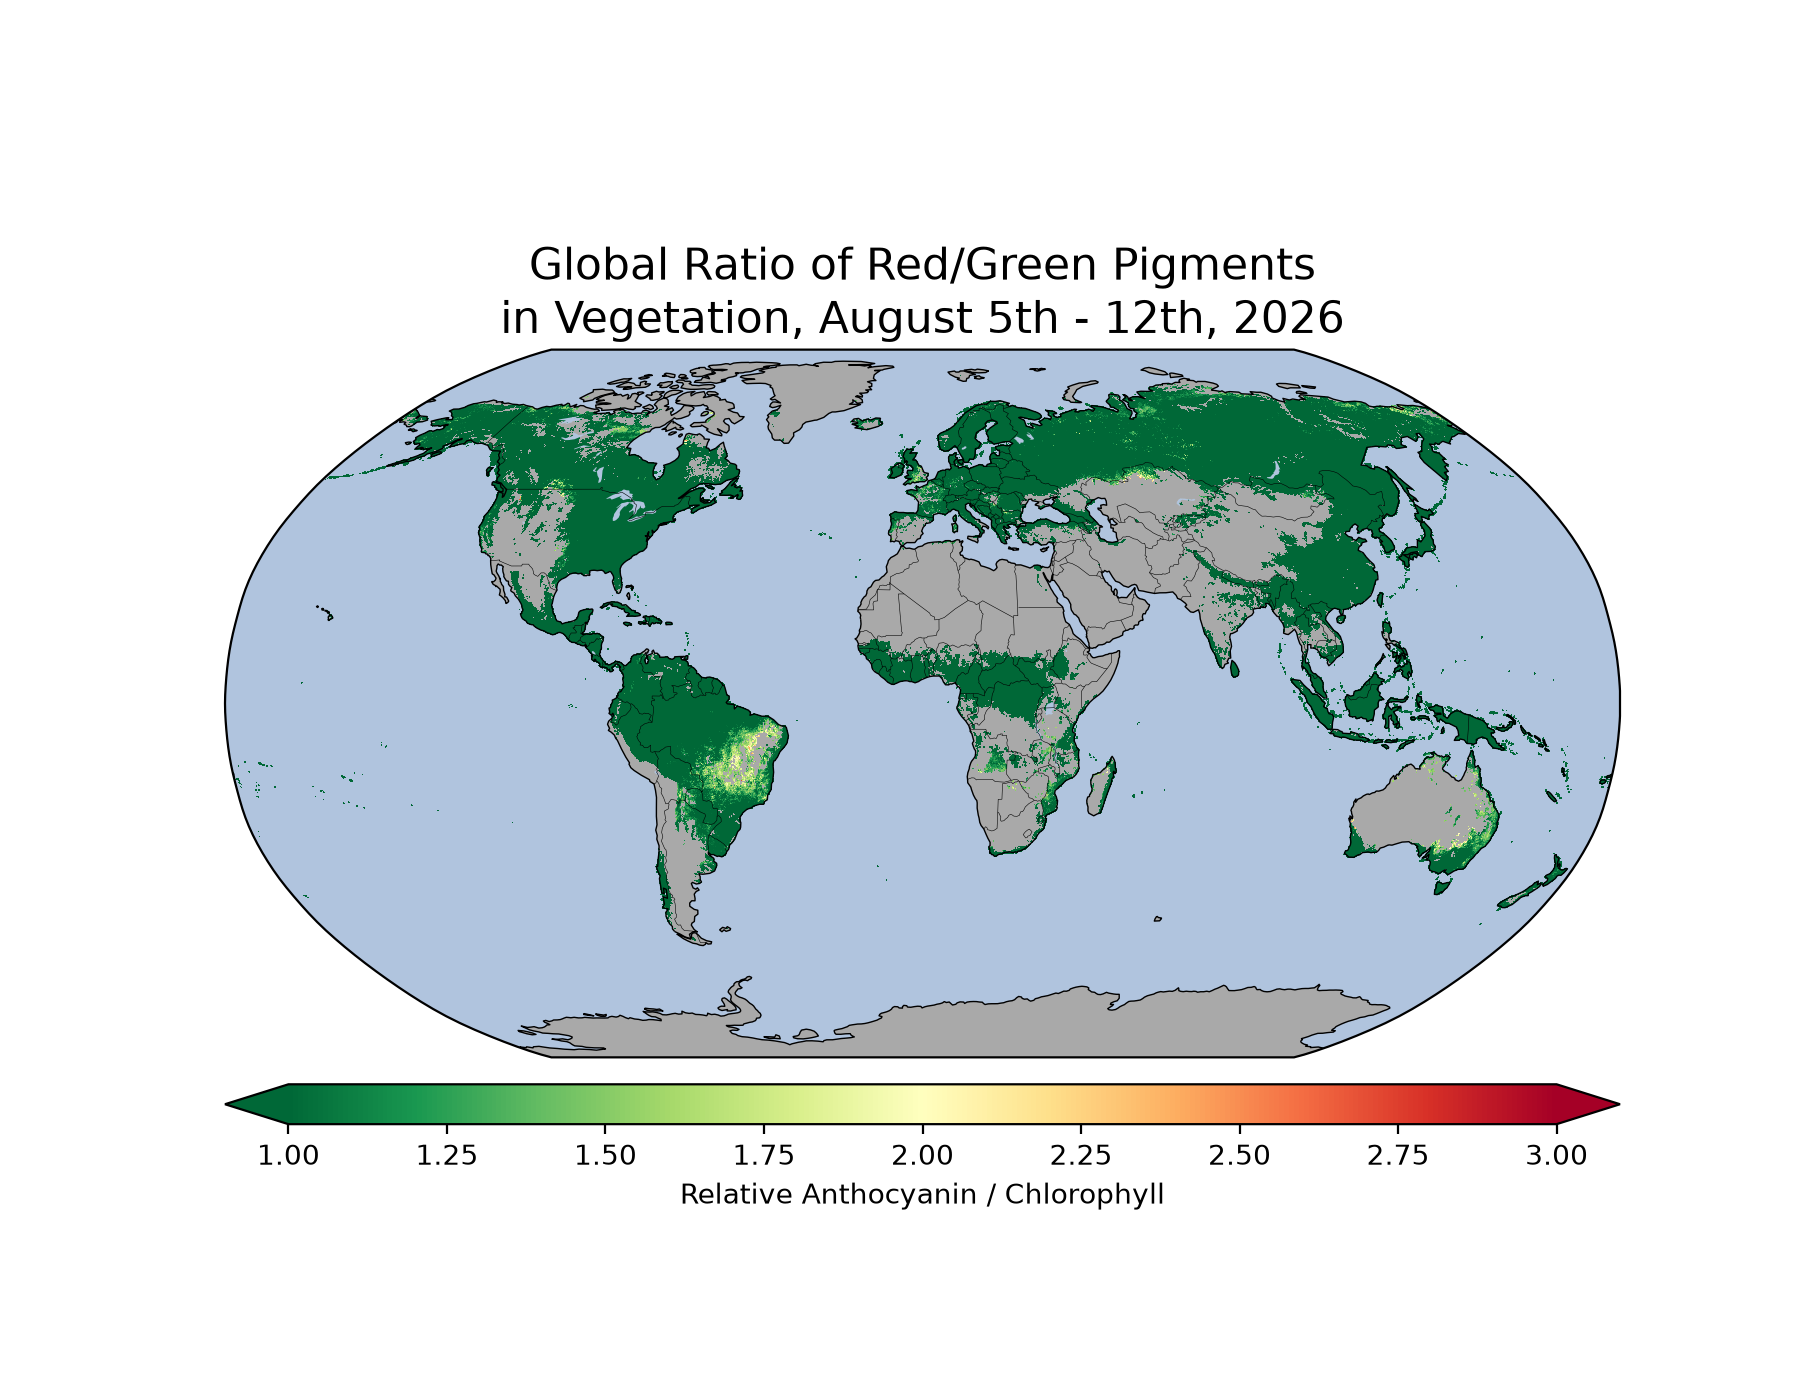
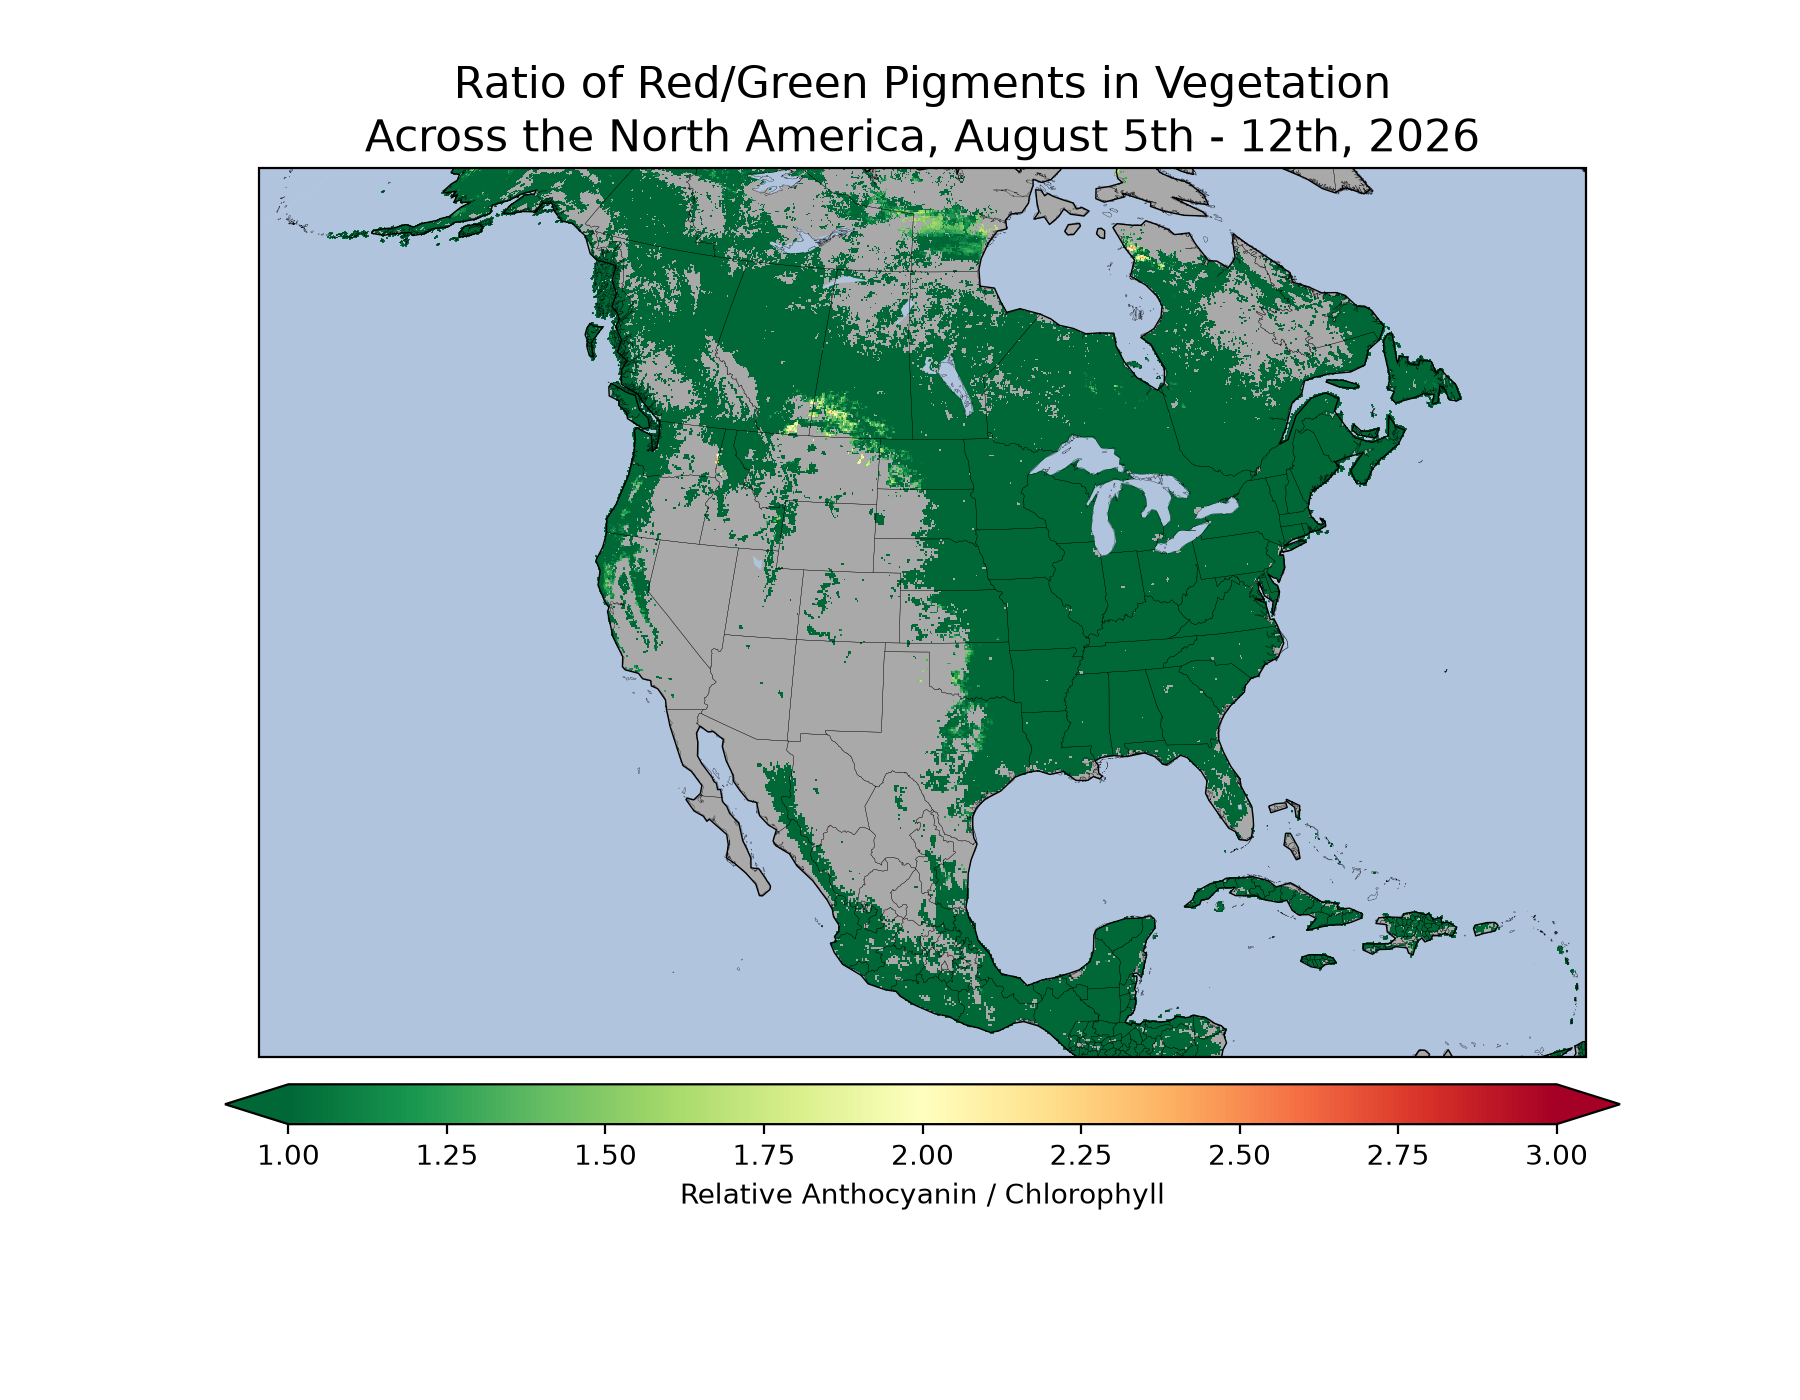
PACE uses reflected light at very specific wavelengths to capture the red (anthocyanin) and green (chlorophyll) pigments in plants. Those pigments can then be compared to assess which color is most dominant on a broad scale. Values close to 1, represented in green on the maps below, mean that the reds and greens are about even, while higher values, shown in yellow and red, mean that the leaves have relatively more red pigment than green. When enough reds overtake the greens, the leaves start to change color to the human eye, making them perfect for leaf peeping!
Note: Not all the yellows and reds on the map represent fall colors. For example, agricultural areas may show up with high anthocyanin values when crops are starting to senesce or after harvest. Some agricultural regions of Brazil appear in the maps in September, and the United States Midwest (the "corn belt") will start showing signs soon.
See the images below for global and North American region maps for weeks beginning in August 2026. Earlier maps are at the bottom of the page and more current maps will be added to the top of the page throughout the fall. Each week (starting with September 14-21) will include a summary of what is occurring on the map.
September 22nd-28th, 2026
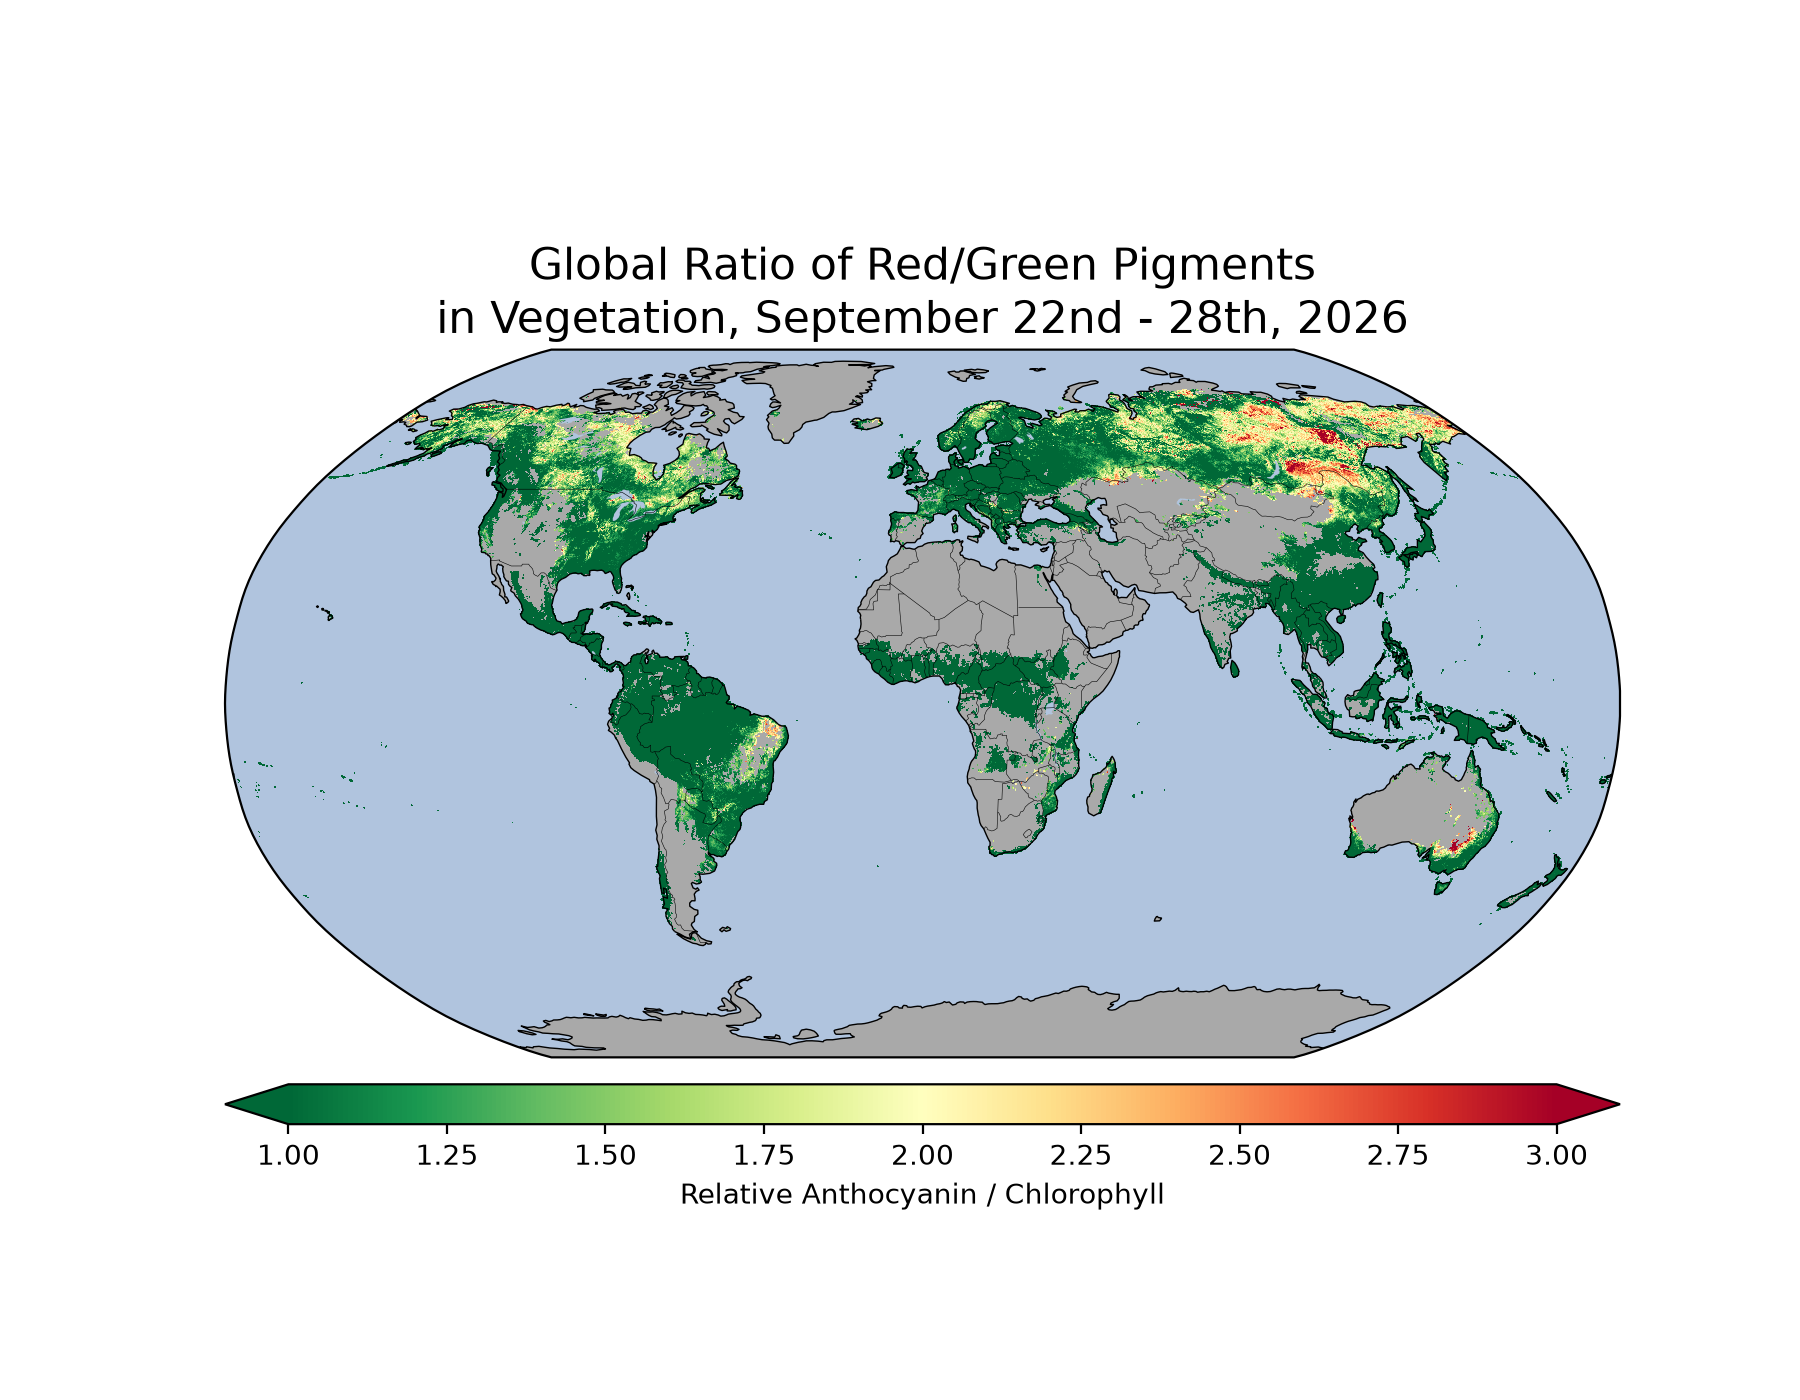
Globally, color is spreading across Northern European countries like Sweden and Norway. Anthocyanin signals across North American countries are intensifying as well, while forests in countries across East Asia and Central/Western Europe continue to show relatively high amounts of chlorophyll. The strong color change in eastern Siberia is because boreal forests are dominated by larch trees, which are deciduous conifers, that is, needle-leaved trees who lose their needles in the fall and grow new ones in the spring. Expand September 22 global image.
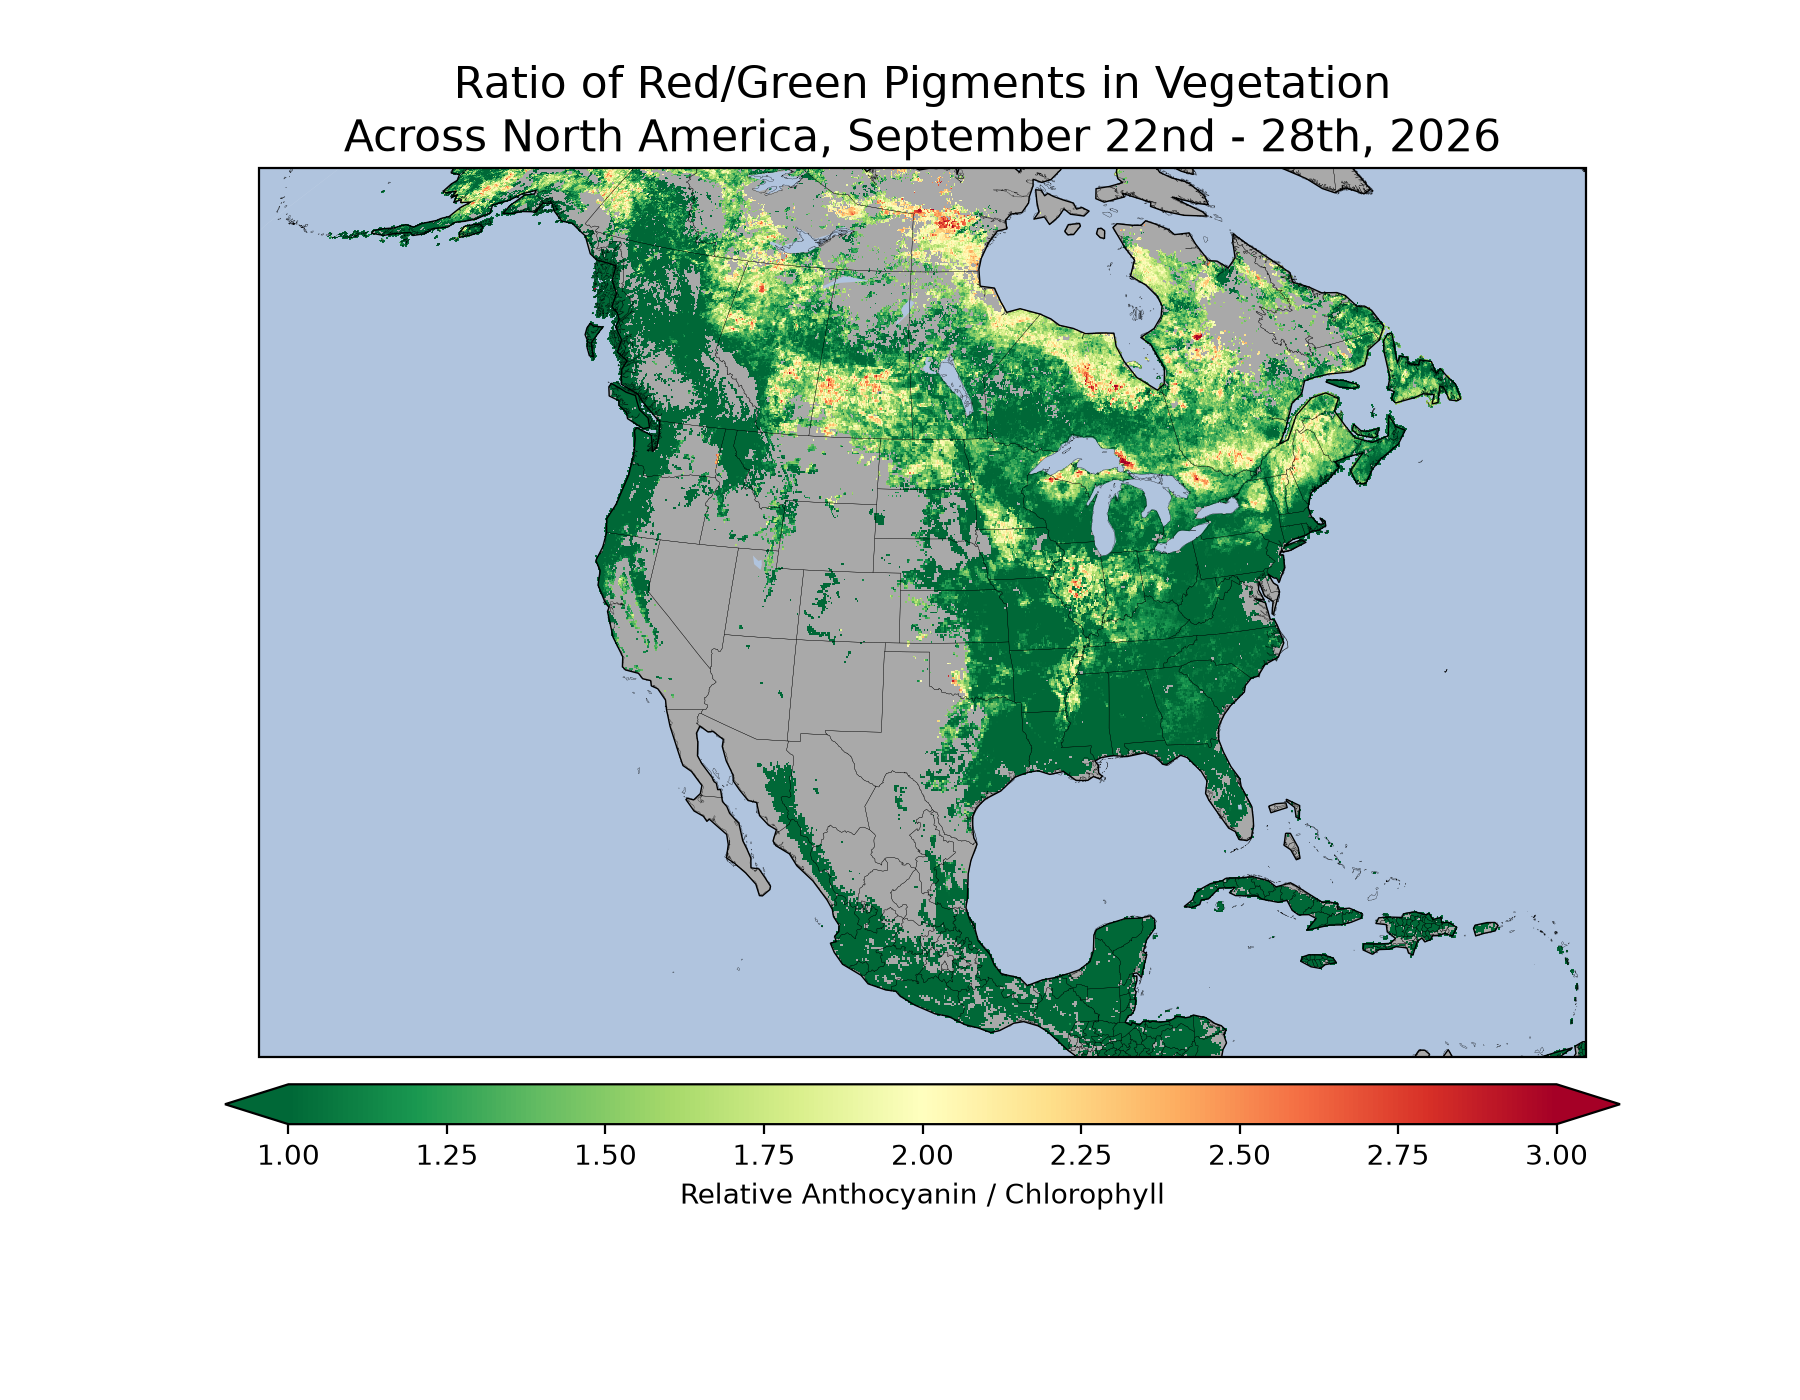
This week, from September 22nd - 28th, we can see that red pigments are spreading across Canada and the northeastern United States, with colors appearing throughout much of Quebec and Ontario, as well as in the mountains in New England and northern New York. The Hudson Bay Lowlands and Great Lakes regions continue to show higher values of anthocyanin. Red pigment in agricultural areas is increasing as well, with the corn belt across the United States showing a concentrated amount of anthocyanin compared to last week’s figures. Expand September 22 North America image.
September 14th-21st, 2026
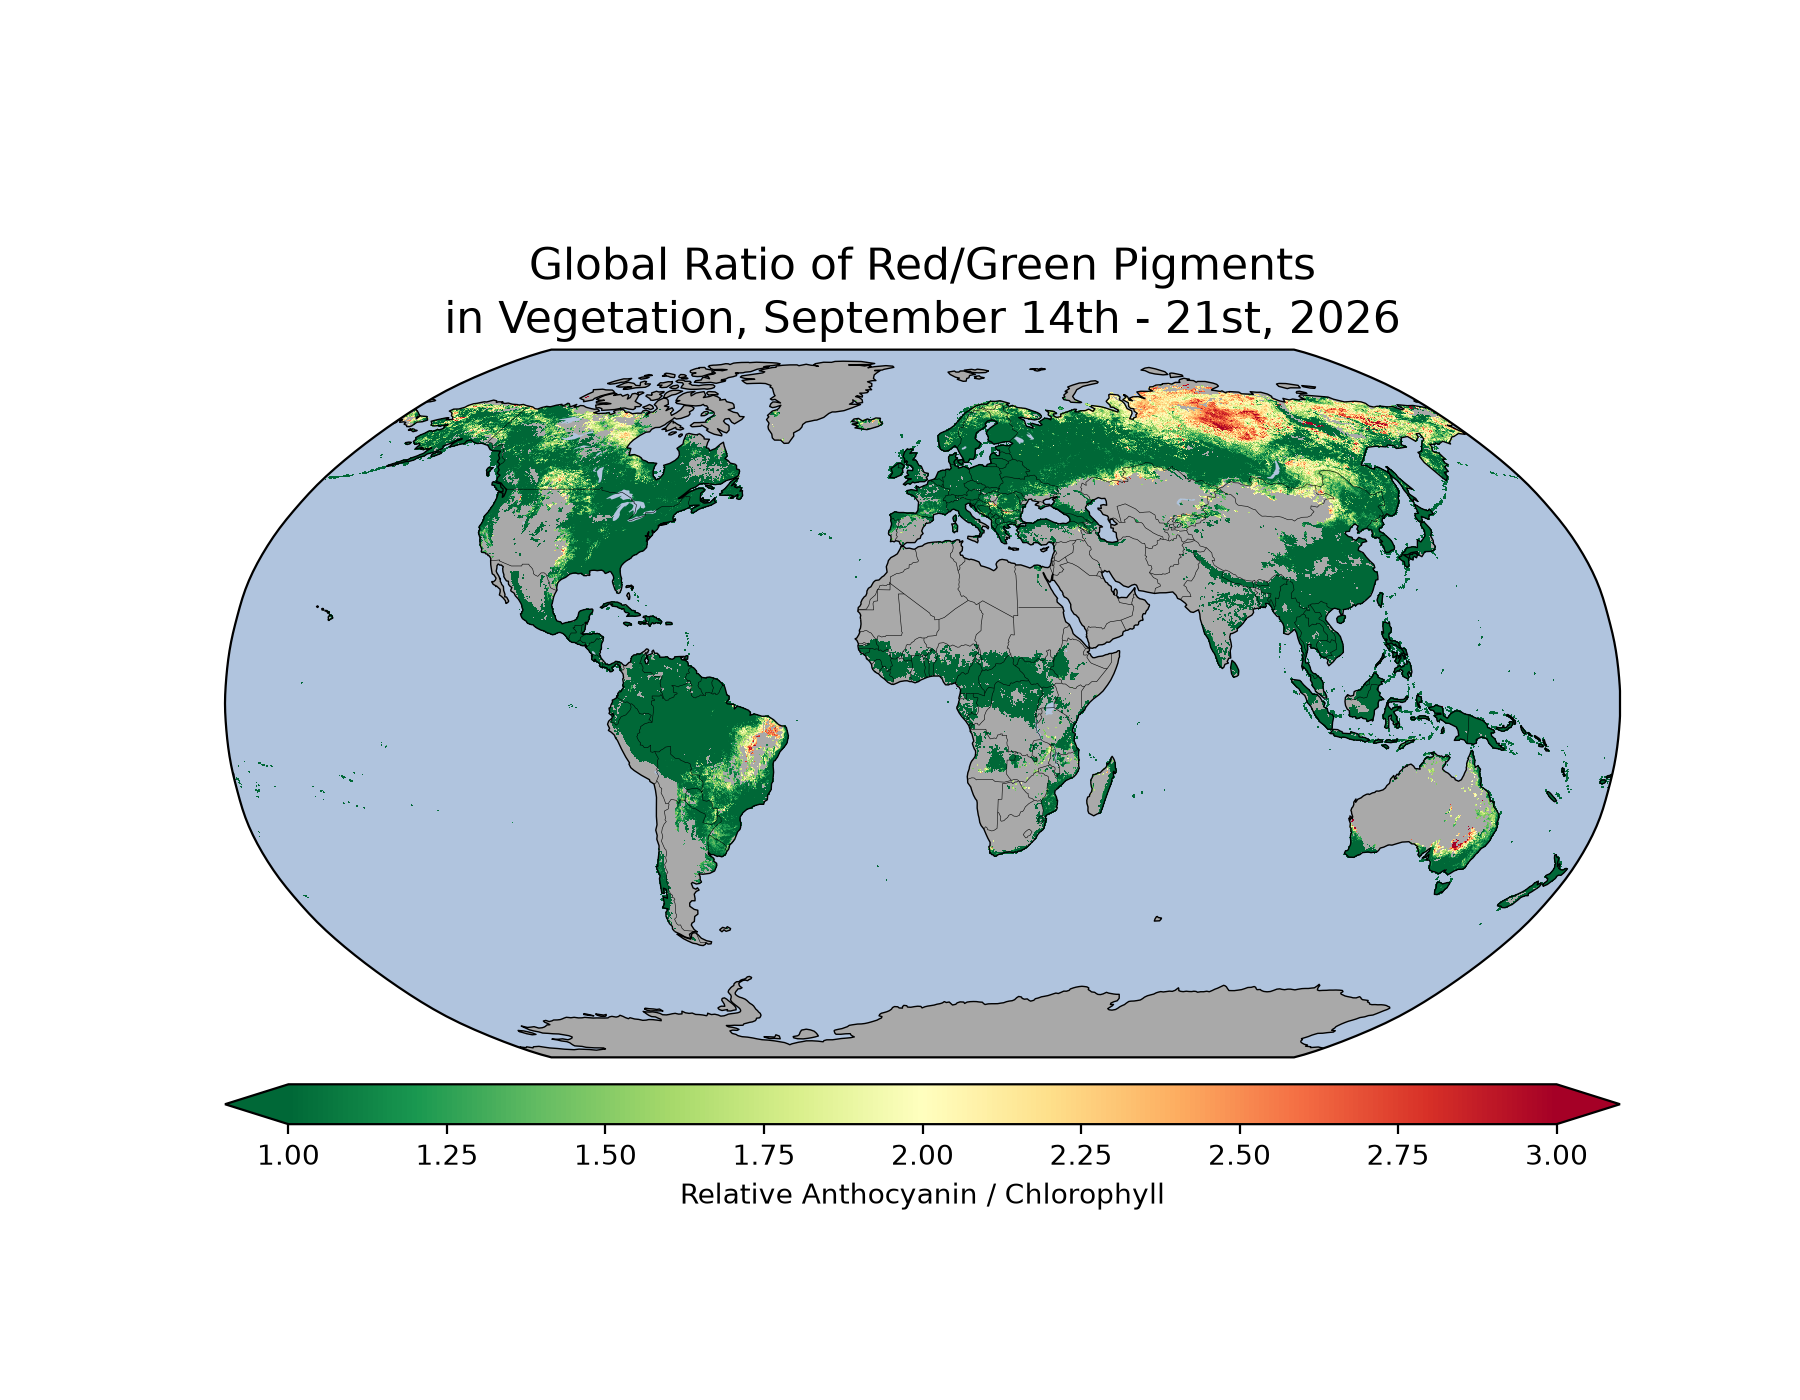
Globally, Siberia is starting to see very high values of red pigment compared to greens as we reach the first official days of autumn. The same changes are starting to be seen in Northern Europe and Canada. Shifts in pigment can also be seen in some agricultural areas in Brazil and the Canadian Prairies. Expand September 14 global image.
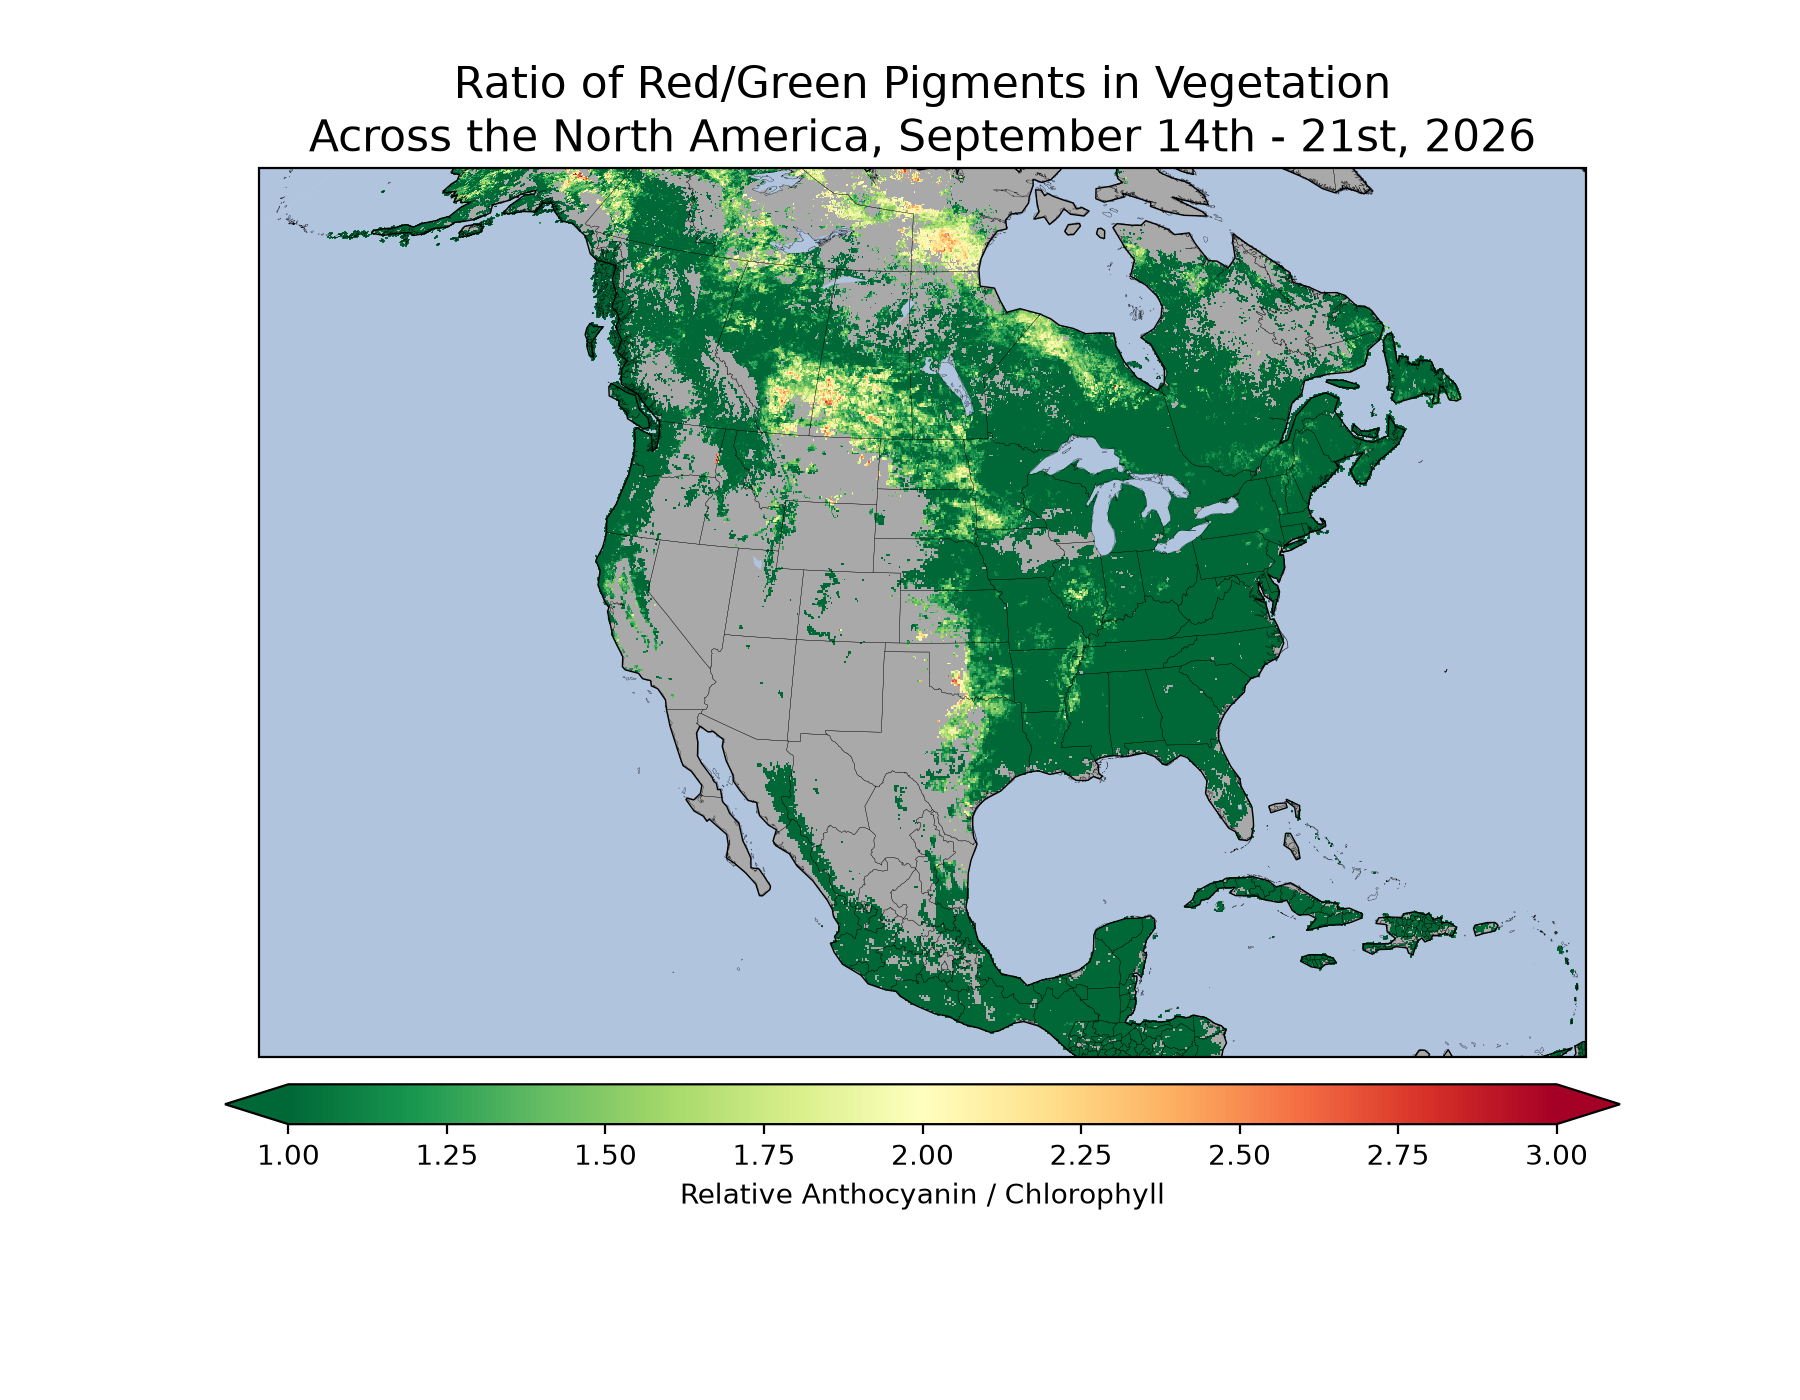
This week, from September 14– 21, we can see higher amounts of red pigment starting to appear across northern Canada and Hudson Bay Lowlands. Some of those same pigments are appearing in the agricultural areas of the Canadian Prairies and along the banks of the Mississippi River in the United States. The color changes visible in central Canada are likely due to the aspen woodlands of the southern boreal forest changing color. Expand September 14 North America image.