Student Project Support - Clouds Protocol


Student Project Support
The purpose of this page is to outline some project approaches that focus on the use of existing GLOBE cloud data. The ideas outlined here can be done without making your own cloud observations outside. Cloud observations should only be made if it is safe and observers can follow local safety guidelines. Remember that ideas are not limited to those presented here.
Contact the NASA GLOBE Clouds Team if you have questions.
You can use the satellite matches associated with cloud observations to investigate the conditions at the time of an observation. Investigate similarities and differences between the observer’s perspective and the satellite perspective. Many observations from North America include GOES satellite matches.
Ideas for students in elementary school:
1). Cloud Observations

Learn about clouds by using cloud photos previously submitted to GLOBE. Make your own cloud observations by viewing the photos. Record your observations on the data collection sheet or in a journal. Do not submit these observations to GLOBE.
- Use the GLOBE Visualization tool to find observations.
- You can use the Data Collection Sheet or a journal to record your cloud observations.
- The Family Cloud Challenge page has a wealth of information to learn about clouds. This includes videos highlighting NASA researchers who study clouds in multiple ways
- Remember not to submit the observations you make from the photos.
What can you do with these observations?
- Ask questions about what you observe.
- Look for patterns.
- Look for corresponding weather events such as precipitation.
- Compare your observations with what was submitted to see if they are the same.
If you want to go beyond making observations from photos, try one of the ideas below.
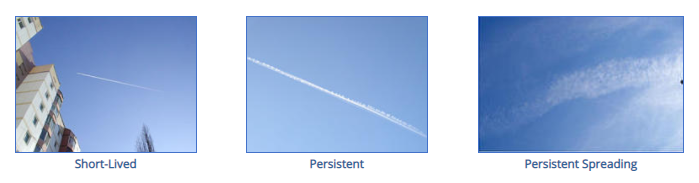
2). Contrail Identification
Use photos from observations that identified at least one contrail. Examine the photos to determine if you can see the contrails.
-
Use this Contrail Data File that has been specifically created for this purpose (Google Sheets version of Contrail Data File also available).
-
You can use the Data Collection Sheet or a journal to record your cloud observations.
-
Learn about contrails on the Importance of GLOBE Data in the Study of Contrails page.
-
Remember not to submit the observations you make from the photos.
What can you do with these observations?
-
Compare your observations with what was submitted to see if they are the same.
-
Ask questions about what you observe.
-
Look for patterns.
-
Keep a log of differences for your project.
-
Make recommendations on how to improve contrail observations or data quality.
-
Remember that non-persistent contrails may have dissipated before the original observer took photos.
-
3). Clouds and Mood
Do you think clouds can affect people’s mood and/or productivity? Design a survey to determine feelings of happiness, energy, sadness, boredom, etc. and/or levels of productivity among your classmates. Then, make daily cloud observations for at least several days while you also survey your classmates every day. Can you find a correlation between cloud cover or cloud types and your classmates’ mood/productivity?

4). Can your pet predict weather better than you?
Can you predict rain given your knowledge about nimbostratus and cumulonimbus clouds? Do you think your pet can predict rain as well or better than you? Make daily cloud observations and log your daily pet’s behavior and sleep patterns. See if your pet acted differently before it rains. What do you think your pet is reacting to? Sound? Temperature? Smell? Maybe you could also interview a pet store owner or a veterinarian!

5). Clouds and weather parameters
Do you think there is any relationship between the types of clouds you see in your sky and your local weather? After making cloud observations for a couple of weeks (within the same season), see if there is a correlation between types of clouds and local air temperature/barometric pressure/winds.
Ideas for students in secondary school:
1). Cloud Observations
- Use the GLOBE Visualization tool to find observations.
- You can use the Data Collection Sheet or a journal to record your cloud observations.
- Learn more about clouds by watching videos highlighting NASA researchers who study clouds in multiple ways.
2). Contrail Identification
Use photos from observations that identified at least one contrail. Examine the photos to determine if you can see the contrails.
- Use this Contrail Data File that has been specifically created for this purpose (Google Sheets version of Contrail Data File also available).
- You can use the Data Collection Sheet or a journal to record your cloud observations.
- Learn about contrails on the Importance of GLOBE Data in the Study of Contrails page.
- Remember not to submit the observations you make from the photos.
What can you do with these observations?
-
Compare your observations with what was submitted to see if they are the same.
-
Ask questions about what you observe.
-
Look for patterns.
-
Keep a log of differences for your project.
-
Make recommendations on how to improve contrail observations or data quality.
-
Remember that non-persistent contrails may have dissipated before the original observer took photos.
-
Take it further:
-
Use Flight Radar 24 to find corresponding flight data to see if you can find a correlation between contrail formation and flight activity. Look for flight paths in the vicinity of the observation.
3). Obscured vs. Overcast

Use photos from observations that identified either obscured or overcast conditions. These categories are often confused. Examine the photos to determine if the observer was correct.
- Use the GLOBE Visualization tool to find observations or use this Obscured and Overcast Data File that has been specifically created for this purpose (Google Sheets version of Obscured and Overcast Data File also available).
- You can use the Data Collection Sheet or a journal to record your cloud observations.
- Learn about this aspect of observations at Overcast versus Obscured: What’s the difference?
- Remember not to submit the observations you make from the photos.
What can you do with these observations?
- Compare your observations with what was submitted to see if they are the same.
- Keep a log of differences for your project.
- Practice making observations from the photos.
- Ask questions about what you observe.
- Look for patterns.
- Make recommendations on how to improve identification of overcast and obscured conditions.
Take it further:
- Look for events associated with obscured skies such as fires or dust storms.
- Use NASA Worldview to find satellite images of events. This Guide to Using NASA Worldview in the Classroom may help.
- You might also find information about specific events at NASA Earth Observatory.
4). Air Quality
Use photos from observations that identified obscured conditions. Look for those that indicate either volcanic eruptions, haze, dust or smoke. You can find this if the word true is next to the category. Examine the photos to determine if you can see the obscuration.
- Use the GLOBE Visualization tool to find observations or use this Smoke Obscurations Data File (September 2020) that has been specifically created for this purpose (Google Sheets version of Smoke Obscurations Data File also available).
- You can use the Data Collection Sheet or a journal to record your cloud observations.
- Learn about this aspect of observations at Wildfire Observations on GLOBE Using the Cloud Protocol.
- Remember not to submit the observations you make from the photos.
- If you have questions about air quality investigations, please contact us at LaRC-GLOBE-AirQuality@mail.nasa.gov.
What can you do with these observations?
- Compare your observations with what was submitted to see if they are the same.
- Sort observations by type of obscuration and look for similarities and differences in the photos to make a claim about the type of obscuration.
(A claim is a statement or conclusion that answers the original question/problem.) - Keep a log of differences for your project.
- Practice making observations from the photos.
- Ask questions about what you observe.
- Look for patterns.
- Integrate data from other sources such as Aerosol Watch and NASA’s WorldView to tell a story about the data.
- Sort observations by type of obscuration and look for similarities and differences in the photos to make a claim about the type of obscuration.
5). Satellite Matches
Use photos from observations with satellite matches. Examine the photos and the satellite match table to identify and classify differences.
- NASA GLOBE Cloud Protocol Satellite Match process, how to read matches and much more are available.
- Watch a video about satellite matches.
- Use the GLOBE Visualization tool to find observations or use this Satellite Match Data File that has been created for this purpose (Google Sheets version of Satellite Match Data File).
What can you do with these observations?
- Use the satellite matches to look for patterns that may identify:
- Observer errors based on photos submitted
- Remember observations are based on a category for percent cloud cover and satellites determine a more precise amount.
- Look for:
- Clouds that observers can see that a satellite may not detect.
- Clouds that the satellite detects that observers may not see.
- Patterns by altitude, cloud type, satellite, etc.
- Observer errors based on photos submitted
* For help creating your own GLOBE data files for these projects, please see the tutorial for creating contrail, overcast and obscured skies and smoke observations files.
6). GOES Resources

To help with GOES investigations, a file of GLOBE Cloud Observations with corresponding GOES data from September 8 – 16, 2020 is available (Google Sheets version of GOES data from September 8-16, 2020). These observations include photos and GOES 16/17 satellite matches for two channels (visible and infrared). This GLOBE Visualization recording shows a visualization of the GLOBE observations with Terra satellite data for the same time period.
Project ideas 2, 4 and 5 on this page are best suited for GOES investigations. In addition to these ideas, investigations might include using the visible and infrared images within the satellite matches to look for patterns that may identify:
- Multiple cloud types leading to a weather event
- Smoke or dust layers from significant events
- Look for:
- How do clouds appear differently in the visible compared to the infrared view?
- How do smoke or dust plumes observed in the visible and infrared images compare? How do these events look similar or different than clouds?
- What patterns do you notice by altitude, cloud type, etc?
Tutorial
- Use the “How to Interpret Satellite Data: GEO” website to learn how to interpret the visible and infrared images taken by the geostationary satellites.
- Use the “Satellite Meteorology Learning Modules” to learn more about how satellites work and how to analyze the data.
GLOBE resources for projects.
- Information about the GLOBE International Virtual Science Symposium includes rubrics for how projects are evaluated.
- GLOBE U.S. Student Research Symposia have been in person and virtual.
- The GLOBE Mission Earth Poster Template is also available.
Other NASA Resources for use in Science Projects
- My NASA Data has a data visualization tool which includes cloud, precipitation, aerosols and temperature data sets. Written and video tutorials are available to help you. These data may help you integrate other data with existing cloud observations.
- EOKids is a series of written materials on various topics. It is for audiences aged 9-14. These may help with background research.
- Use NASA Worldview to find satellite images. This Guide to Using NASA Worldview in the Classroom may help.
- NASA Earth Observations (NEO) allows you to browse and download satellite imagery from NASA’s Earth Observing System satellites. Using NASA Earth Observations (NEO) in 10 Easy Steps can help you get started.
- NASA’s Giovanni tool is more advanced.
7). Clouds and ultraviolet rays
The Ultraviolet (UV) Index is a measure of the intensity of ultraviolet rays from the sun, and it can help determine how the sun can affect us during outdoor activities. While some exposure to the sun’s rays is beneficial to help our bodies produce vitamin D, too much exposure to UV rays can be harmful.
In many countries, the UV Index is reported along the weather forecast on TV, on the radio, or in newspapers. The UV Index for some world locations can also be found on the Internet. For example, the Finnish Meteorological Institute has a web page where you can first select a world region and then a specific town to find its UV Index:

How much of an impact do you think clouds have on how much UV radiation we get? Make daily cloud observations for at least several days and keep track of the cloud cover and the cloud types you see. Do you find any correlation between your cloud observations and the Ultraviolet (UV) Index?
IMPORTANT: Remember, even during cloudy days, overexposure to sunlight can be harmful to our eyes and our skin. Therefore, it is important to wear sunglasses and apply sunscreen!
8). Cloud Opacity
Use Worldview and see if the Cloud Optical Thickness correlates with the cloud opacity you observed at a given location/time.
GLOBE resources for projects
- Information about the GLOBE International Virtual Science Symposium includes rubrics for how projects are evaluated.
- GLOBE U.S. Student Research Symposia have been in person and virtual.
- The GLOBE Mission Earth Poster Template is also available.
- How to Conduct Your Literature Review (English/Spanish Webinar)
- How to Develop a Good Research Question (English/American Sign Language Webinar)
- Creating Your Research Poster (English/Spanish Webinar)
- Collecting, Cleaning, and Analyzing Your Data (English only Webinar)
Other NASA Resources for use in Science Projects
- My NASA Data has a data visualization tool which includes cloud, precipitation, aerosols and temperature data sets. Written and video tutorials are available to help you. These data may help you integrate other data with existing cloud observations.
- EOKids is a series of written materials on various topics. It is for audiences aged 9-14. These may help with background research.
- Use NASA Worldview to find satellite images. This Guide to Using NASA Worldview in the Classroom may help.
- NASA Earth Observations (NEO) allows you to browse and download satellite imagery from NASA’s Earth Observing System satellites. Using NASA Earth Observations (NEO) in 10 Easy Steps can help you get started.
- NASA’s Giovanni tool is more advanced.